PBMC CITE-Seq Unbiased Feature Selection
[1]:
import scanpy as sc
import os
import pandas as pd
import numpy as np
import pickle as pkl
import matplotlib as mpl
import matplotlib.pyplot as plt
import scipy.stats

sc.settings.verbosity = 3
[2]:
rna_adata = sc.read("../../CITE-seq/rna.h5ad")
[3]:
data = pd.read_csv("../../CITE-seq/GSE100866_PBMC_vs_flow_10X-ADT_umi.csv", index_col=0)
data
[3]:
| ACCGTAAGTGTAATGA | CGTGAGCTCGAGAACG | CACATTTAGAATTCCC | TACGGTATCTGGGCCA | TCAGGTAGTAAGTTCC | TGATTTCGTTCTCATT | ACACTGAAGGCCCTCA | ACGGGTCGTCACACGC | AGCTTGACATCCCATC | ACGTCAATCCGTCATC | ... | TTCTCCTAGATCGATA | GGAAAGCGTCGACTAT | GACTAACCAACACCCG | AGCGTCGTCCTCGCAT | TCTCATAAGTTTGCGT | GTCGGGTAGAGCTGGT | GTCGGGTAGGTAGCCA | GTCGGGTAGTCTTGCA | ATGTGTGGTCCGTTAA | CGTATGCCGTCTTCTG | |
|---|---|---|---|---|---|---|---|---|---|---|---|---|---|---|---|---|---|---|---|---|---|
| CD3 | 9 | 17 | 18 | 12 | 18 | 16 | 15 | 23 | 18 | 9 | ... | 40 | 184 | 2 | 88 | 8 | 115 | 53 | 10 | 5 | 5 |
| CD4 | 8 | 17 | 18 | 12 | 20 | 29 | 27 | 20 | 28 | 19 | ... | 93 | 157 | 15 | 47 | 6 | 112 | 69 | 14 | 7 | 5 |
| CD8 | 13 | 21 | 16 | 16 | 18 | 25 | 11 | 23 | 21 | 10 | ... | 180 | 26 | 9 | 4 | 8 | 8 | 5 | 32 | 7 | 9 |
| CD2 | 9 | 10 | 7 | 8 | 5 | 15 | 10 | 4 | 3 | 4 | ... | 38 | 184 | 1 | 50 | 2 | 245 | 87 | 21 | 3 | 7 |
| CD45RA | 56 | 37 | 36 | 53 | 74 | 69 | 46 | 44 | 75 | 41 | ... | 66 | 87 | 22 | 302 | 31 | 10 | 12 | 182 | 28 | 22 |
| CD57 | 19 | 40 | 32 | 21 | 33 | 55 | 41 | 30 | 52 | 32 | ... | 15 | 15 | 24 | 7 | 15 | 9 | 3 | 10 | 19 | 7 |
| CD16 | 15 | 11 | 4 | 7 | 14 | 30 | 20 | 22 | 25 | 8 | ... | 17 | 8 | 9 | 1 | 4 | 5 | 0 | 9 | 4 | 2 |
| CD14 | 10 | 7 | 13 | 9 | 15 | 25 | 24 | 21 | 28 | 9 | ... | 152 | 6 | 8 | 3 | 4 | 3 | 2 | 24 | 6 | 3 |
| CD11c | 7 | 6 | 5 | 10 | 14 | 18 | 8 | 18 | 23 | 11 | ... | 203 | 7 | 7 | 3 | 2 | 4 | 1 | 29 | 5 | 1 |
| CD19 | 15 | 14 | 12 | 19 | 17 | 22 | 17 | 12 | 18 | 4 | ... | 7 | 5 | 12 | 1 | 6 | 1 | 3 | 3 | 5 | 4 |
10 rows × 7985 columns
[4]:
adata = sc.AnnData(data.T)
[5]:
adata = adata[rna_adata.obs.index, ]
[6]:
sc.settings.set_figure_params(dpi=80, facecolor='white')
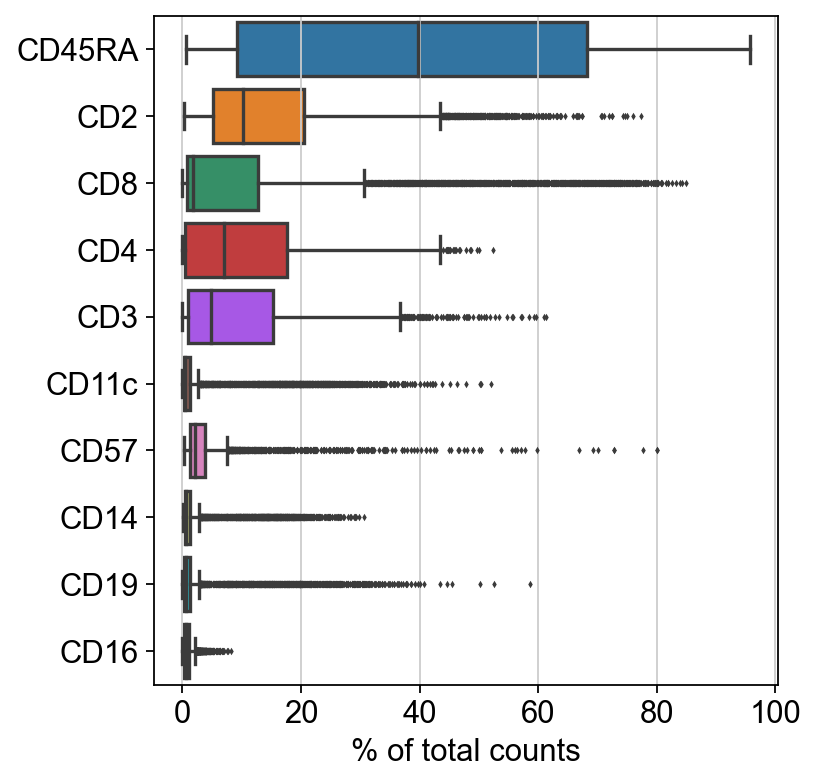
sc.pl.highest_expr_genes(adata, n_top=20)
normalizing counts per cell
    finished ({time_passed})
C:\Users\SLiang3\Miniconda3\envs\scanpy37\lib\site-packages\scanpy\preprocessing\_normalization.py:138: UserWarning: Revieved a view of an AnnData. Making a copy.
  view_to_actual(adata)
[7]:
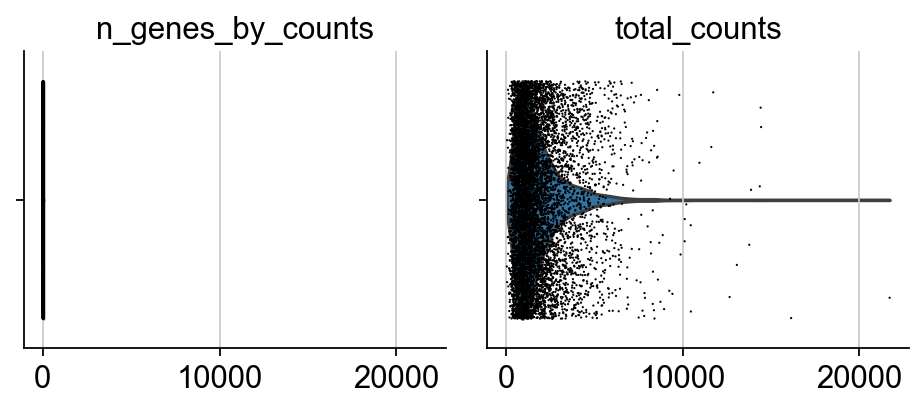
sc.pp.calculate_qc_metrics(adata, percent_top=None, log1p=False, inplace=True)
sc.pl.violin(adata, ['n_genes_by_counts', 'total_counts'], jitter=0.4, multi_panel=True)
C:\Users\SLiang3\Miniconda3\envs\scanpy37\lib\site-packages\seaborn\_core.py:1303: UserWarning: Vertical orientation ignored with only `x` specified.
  warnings.warn(single_var_warning.format("Vertical", "x"))
C:\Users\SLiang3\Miniconda3\envs\scanpy37\lib\site-packages\seaborn\_core.py:1303: UserWarning: Vertical orientation ignored with only `x` specified.
  warnings.warn(single_var_warning.format("Vertical", "x"))
C:\Users\SLiang3\Miniconda3\envs\scanpy37\lib\site-packages\seaborn\_core.py:1303: UserWarning: Vertical orientation ignored with only `x` specified.
  warnings.warn(single_var_warning.format("Vertical", "x"))
C:\Users\SLiang3\Miniconda3\envs\scanpy37\lib\site-packages\seaborn\_core.py:1303: UserWarning: Vertical orientation ignored with only `x` specified.
  warnings.warn(single_var_warning.format("Vertical", "x"))
[8]:
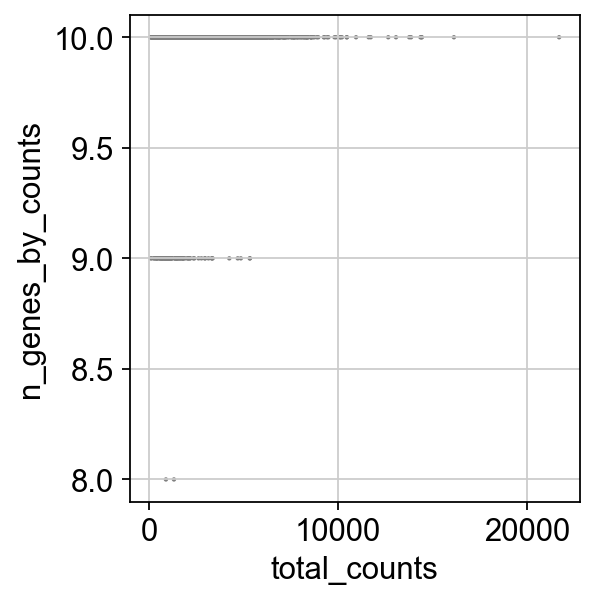
sc.pl.scatter(adata, x='total_counts', y='n_genes_by_counts')
[9]:
adata.var.highly_variable = True
[ ]:
[10]:
#sc.pp.normalize_total(adata, target_sum=1e4)
import scipy.stats.mstats
def clr(adata):
    temp = adata.X + 1
    adata.X = np.log(temp / scipy.stats.mstats.gmean(temp, axis=1).reshape([-1, 1]))

clr(adata)
[11]:
sc.pp.scale(adata, max_value=2)
[12]:
np.isnan(adata.X).sum()
[12]:
0
[13]:
sc.tl.pca(adata, svd_solver='arpack')
computing PCA
    with n_comps=9
    finished (0:00:00)
[14]:
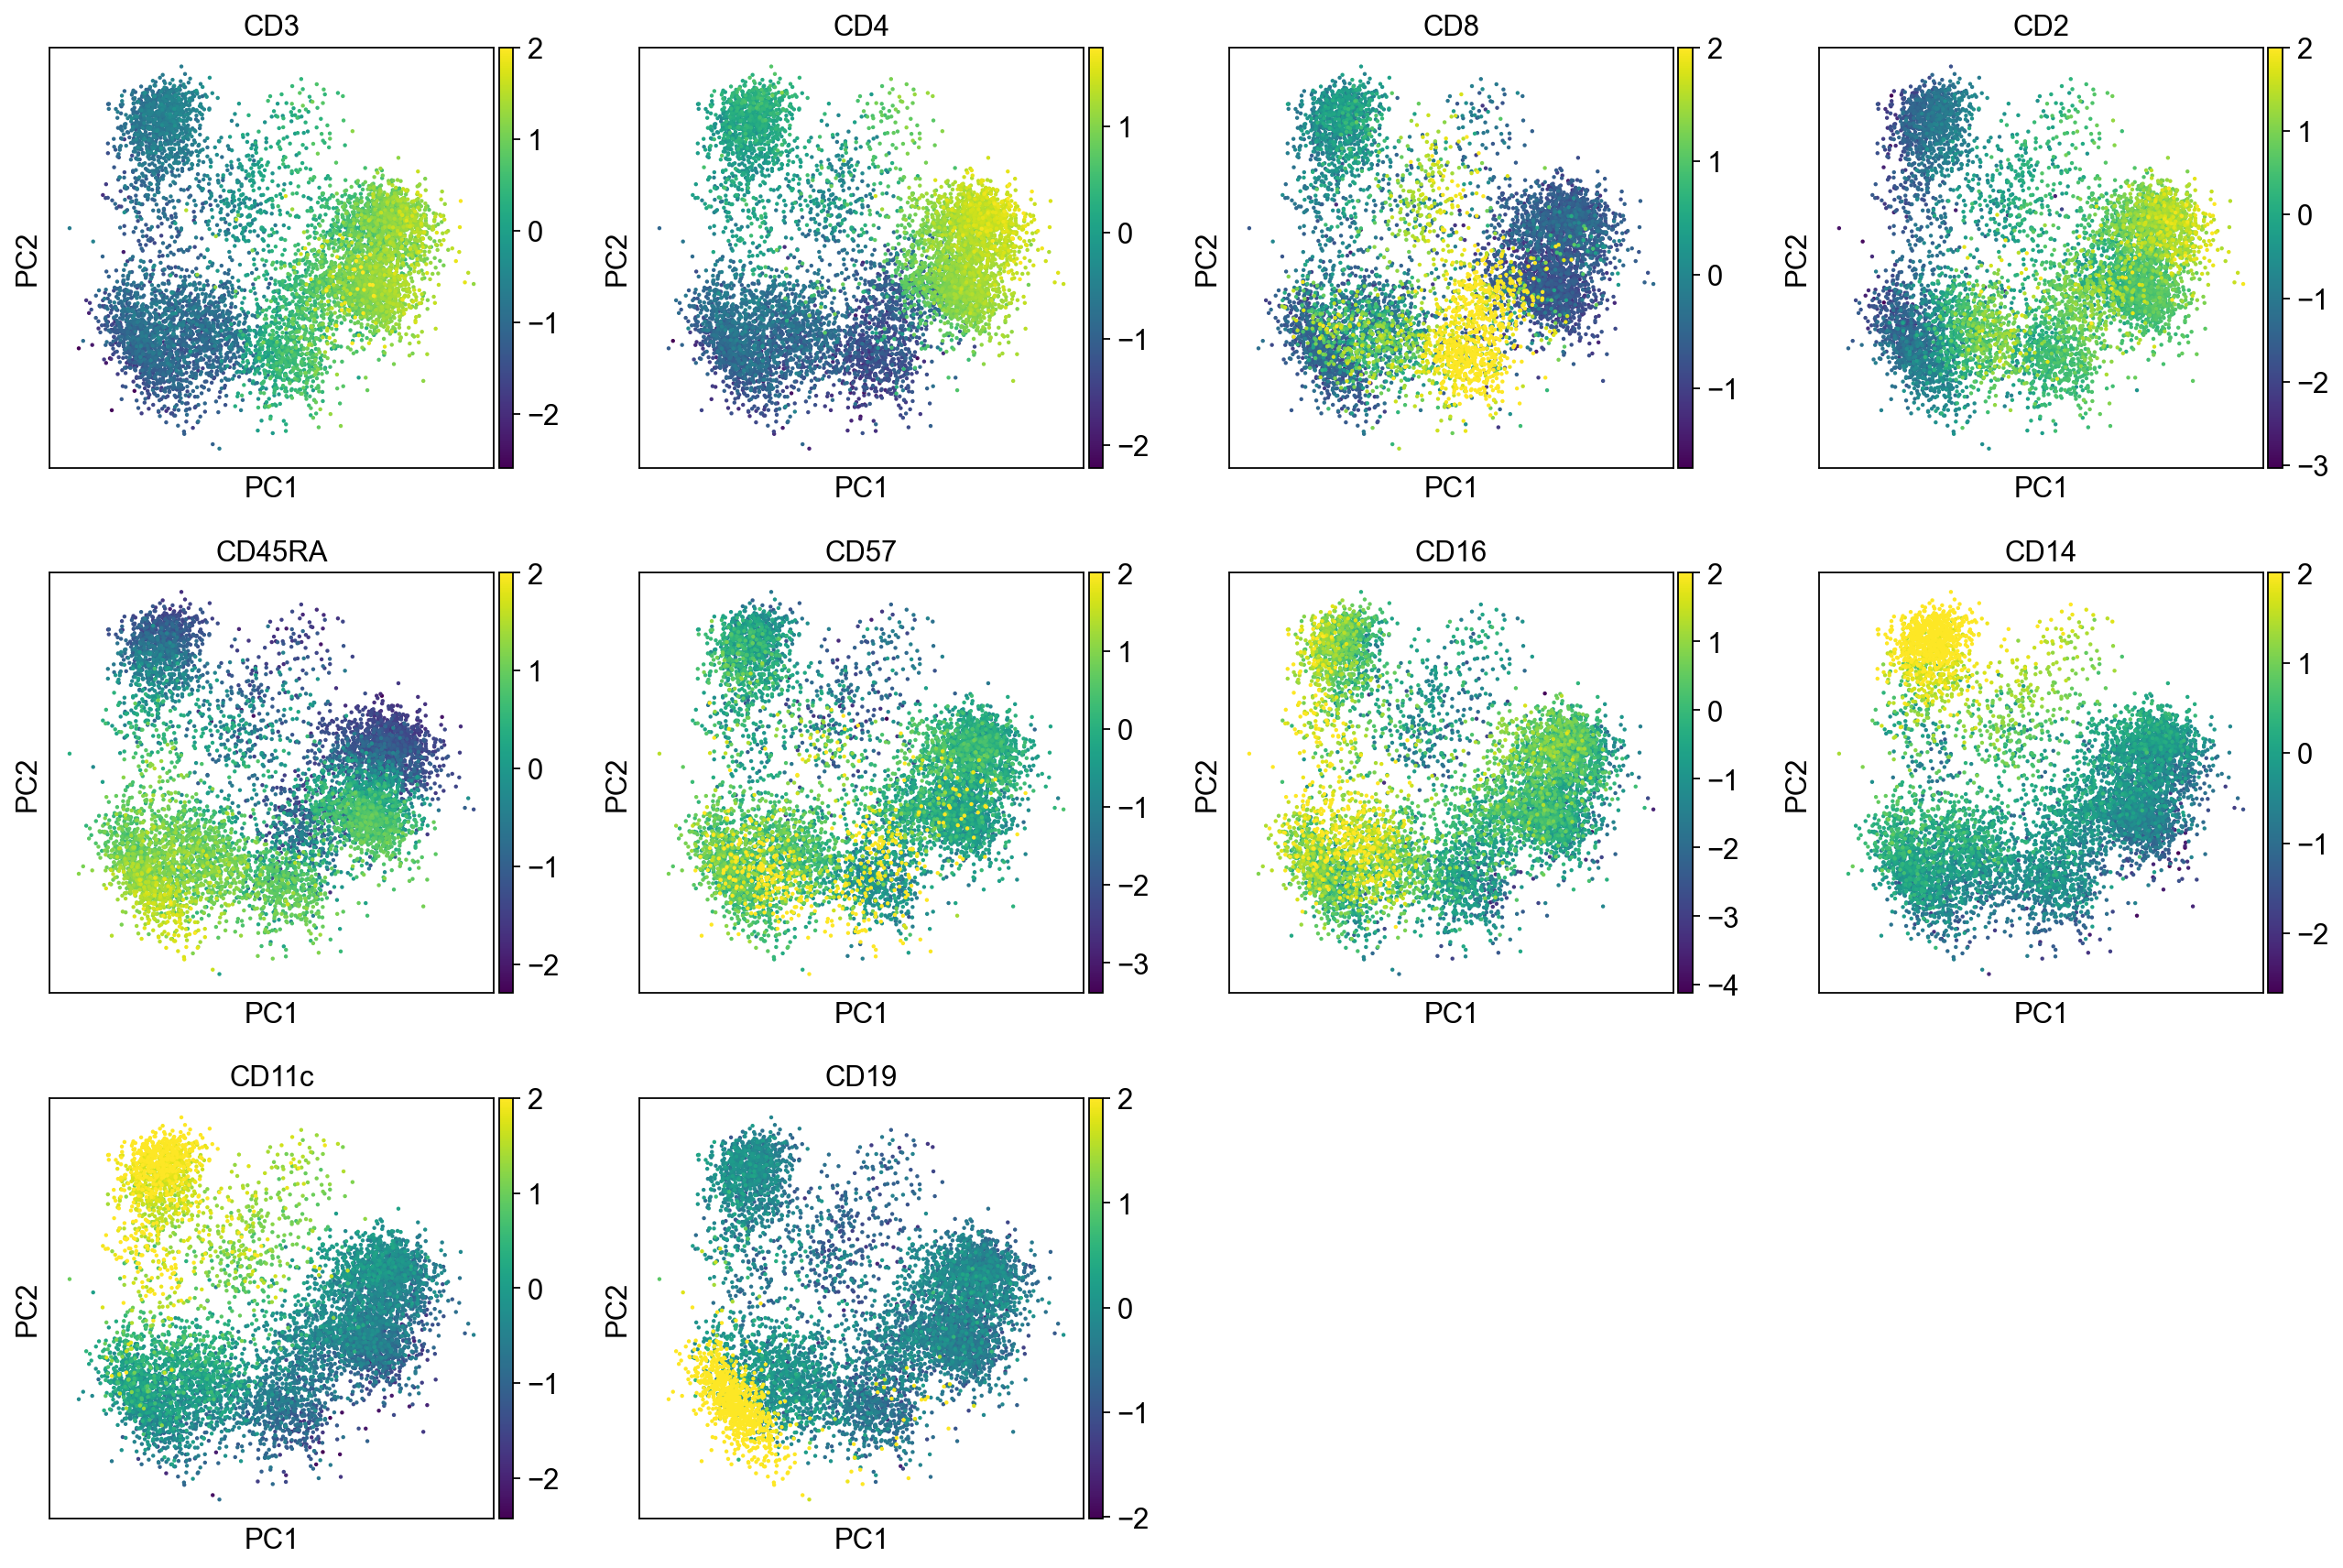
sc.pl.pca(adata, color=data.index)
[15]:
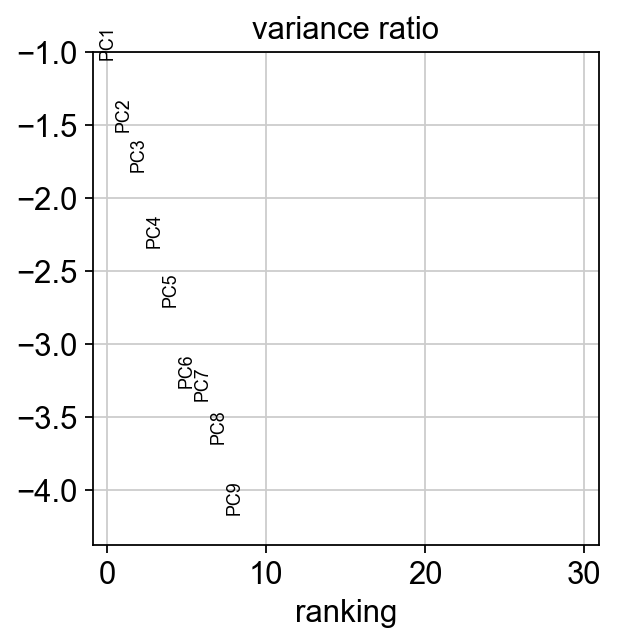
sc.pl.pca_variance_ratio(adata, log=True)
[16]:
sc.pp.neighbors(adata, n_neighbors=50)
sc.tl.umap(adata)
sc.tl.leiden(adata, resolution=2.)
computing neighbors
    using data matrix X directly
    finished: added to `.uns['neighbors']`
    `.obsp['distances']`, distances for each pair of neighbors
    `.obsp['connectivities']`, weighted adjacency matrix (0:00:04)
computing UMAP
    finished: added
    'X_umap', UMAP coordinates (adata.obsm) (0:00:15)
running Leiden clustering
    finished: found 24 clusters and added
    'leiden', the cluster labels (adata.obs, categorical) (0:00:06)
[17]:
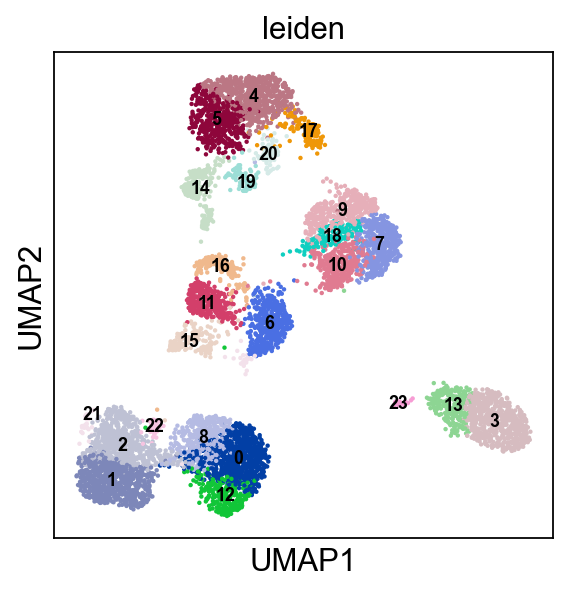
sc.pl.umap(adata, color=['leiden'], ncols=3, legend_loc="on data", legend_fontsize=8.)
[18]:
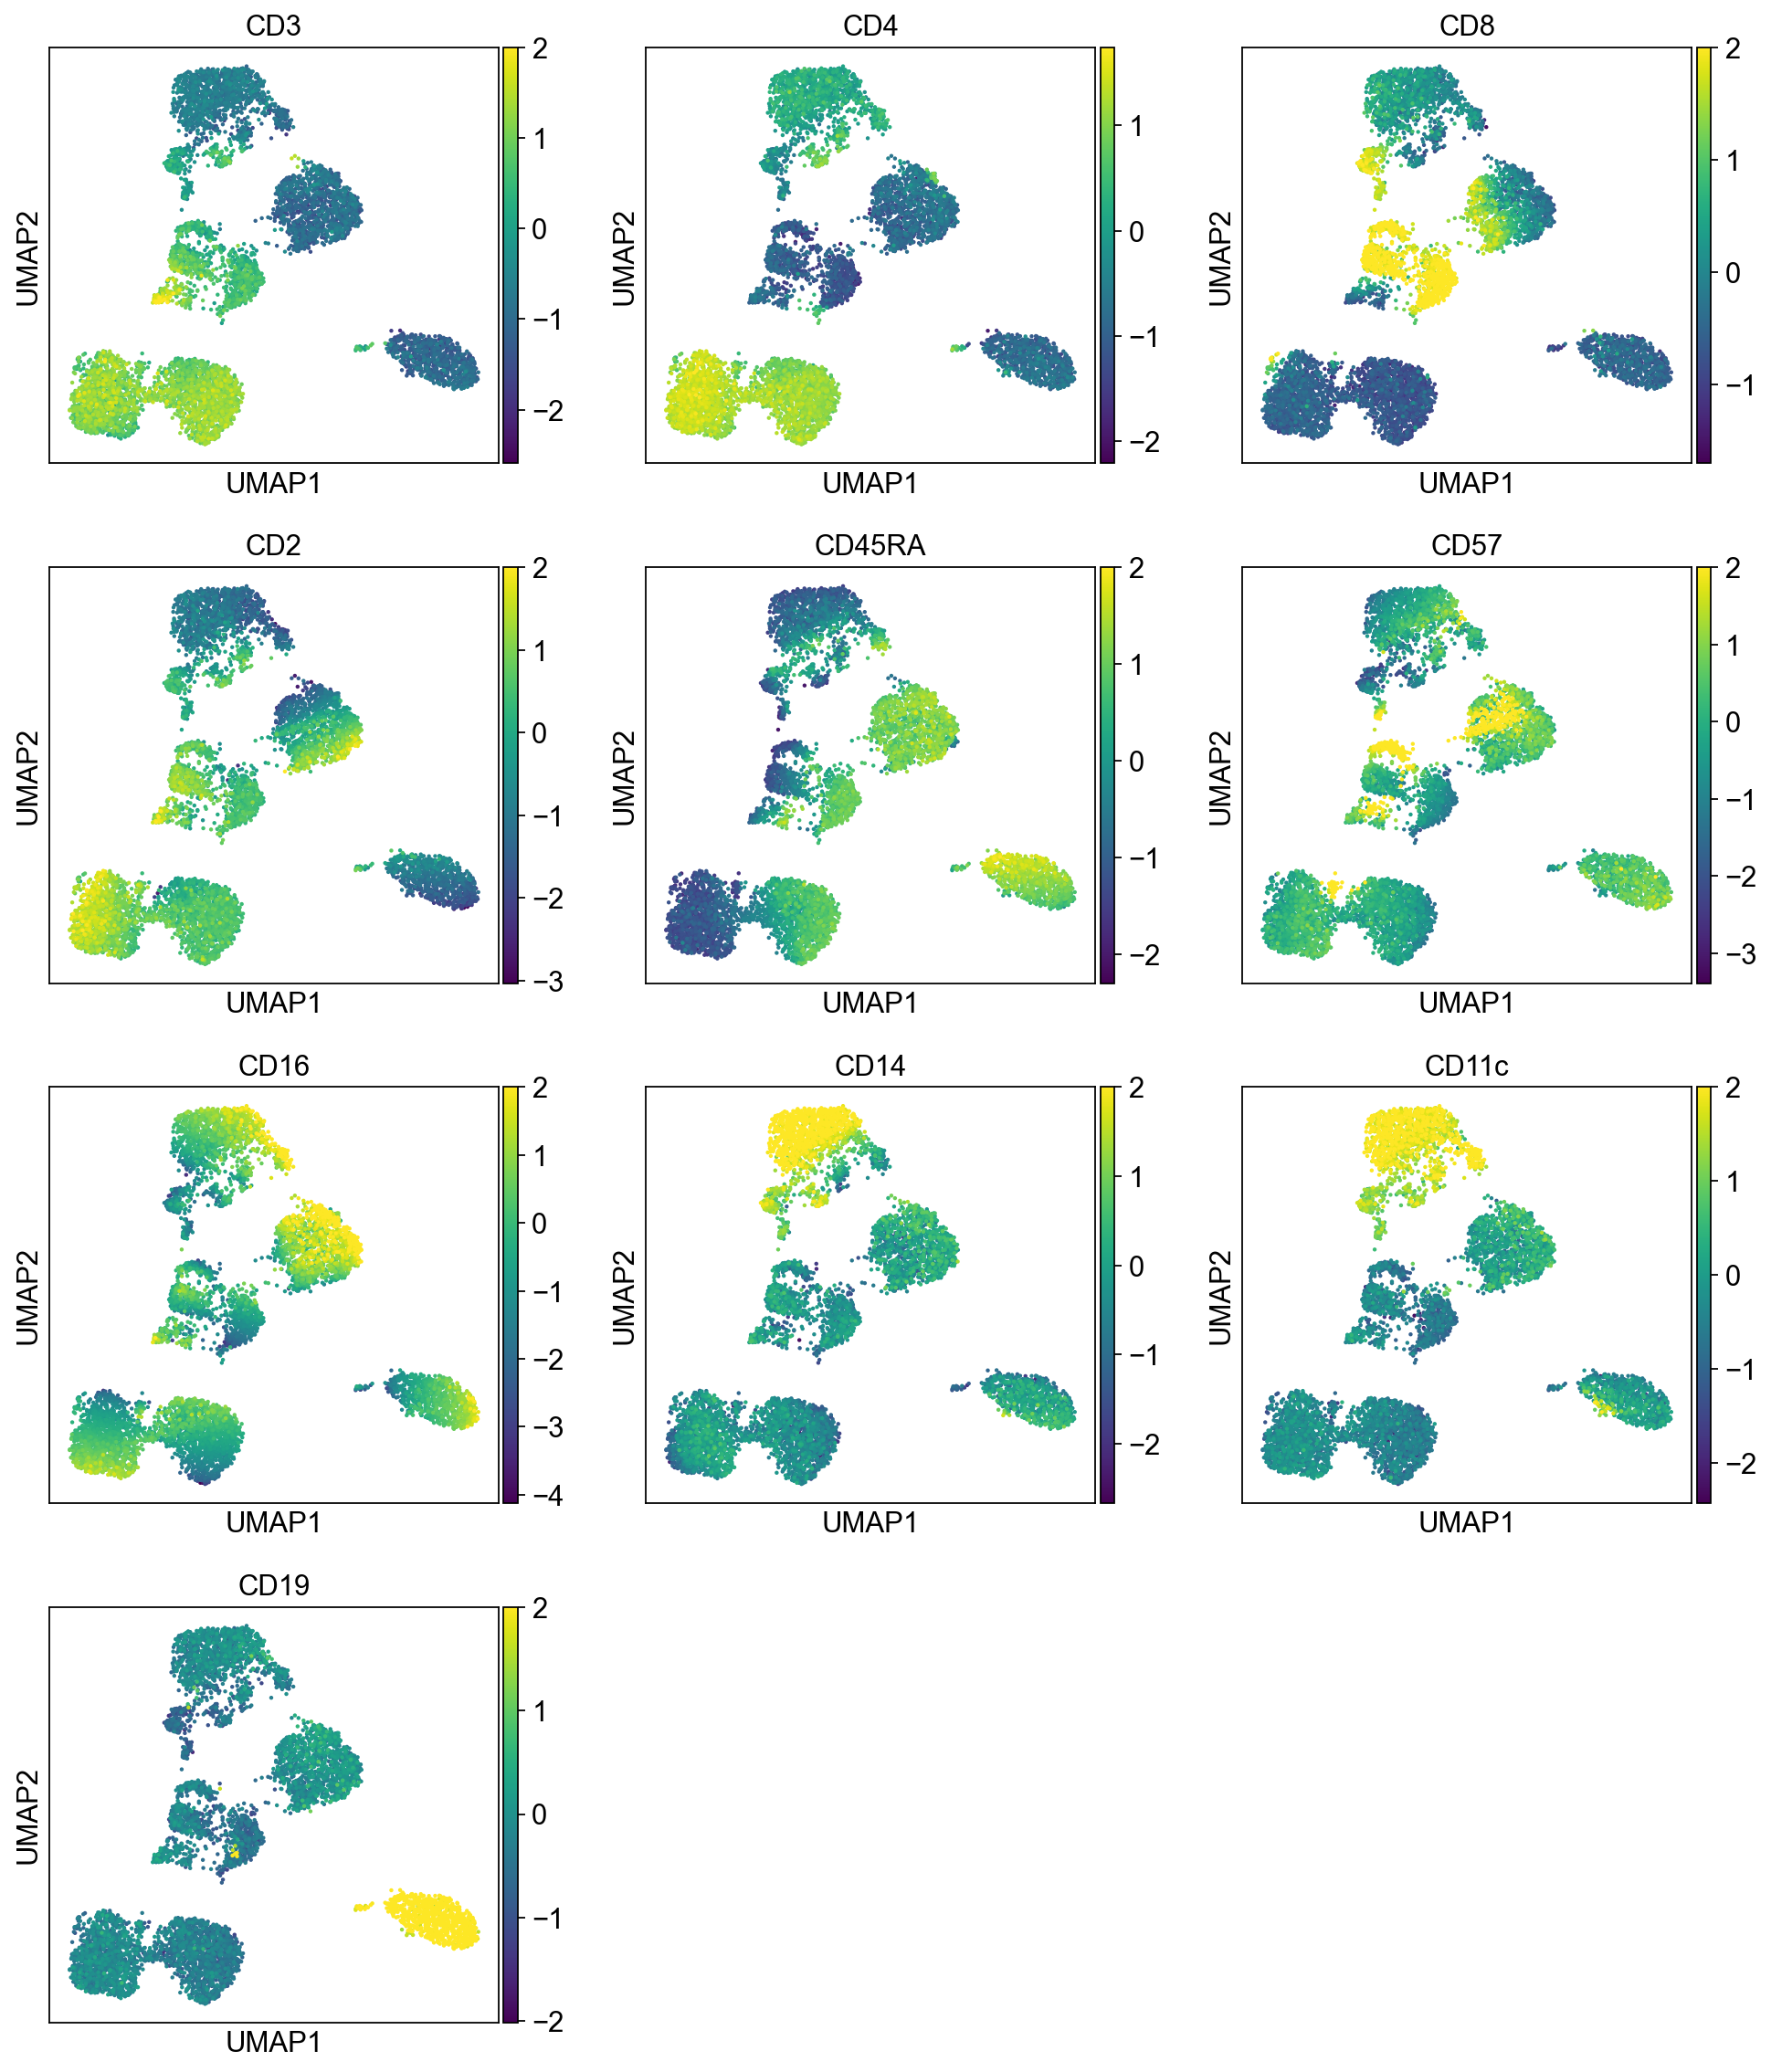
sc.pl.umap(adata, color=data.index, ncols=3, legend_loc="on data", legend_fontsize=8.)
[19]:
filtered_adata = adata.copy()
proteins = filtered_adata.var.index.to_series().apply(lambda x: 'PROTEIN_' + x).tolist()
rnas = rna_adata.raw.var.index.to_series().apply(lambda x: '' + x).tolist()
merged_adata = sc.AnnData(pd.DataFrame(np.hstack([filtered_adata.X, rna_adata.raw.X]),
                                    columns=proteins+rnas))
merged_adata.obs = filtered_adata.obs
merged_adata.obsm = filtered_adata.obsm
C:\Users\SLiang3\Miniconda3\envs\scanpy37\lib\site-packages\anndata\_core\anndata.py:119: ImplicitModificationWarning: Transforming to str index.
  warnings.warn("Transforming to str index.", ImplicitModificationWarning)
[20]:
#print(*merged_adata.var_names)
[21]:
sc.pl.umap(merged_adata, color=['leiden',
'GZMB', 'GZMA', 'NCAM1', 'CD244', # NK (Granzyme)
'CD3D', 'CD3E', 'CD3G', 'CD4', 'CD8A', 'CD8B', # T CD4/CD8
'CD14', 'FCGR3A', 'FCGR3B', # MONO CD14 / (CD16 = FCGR)
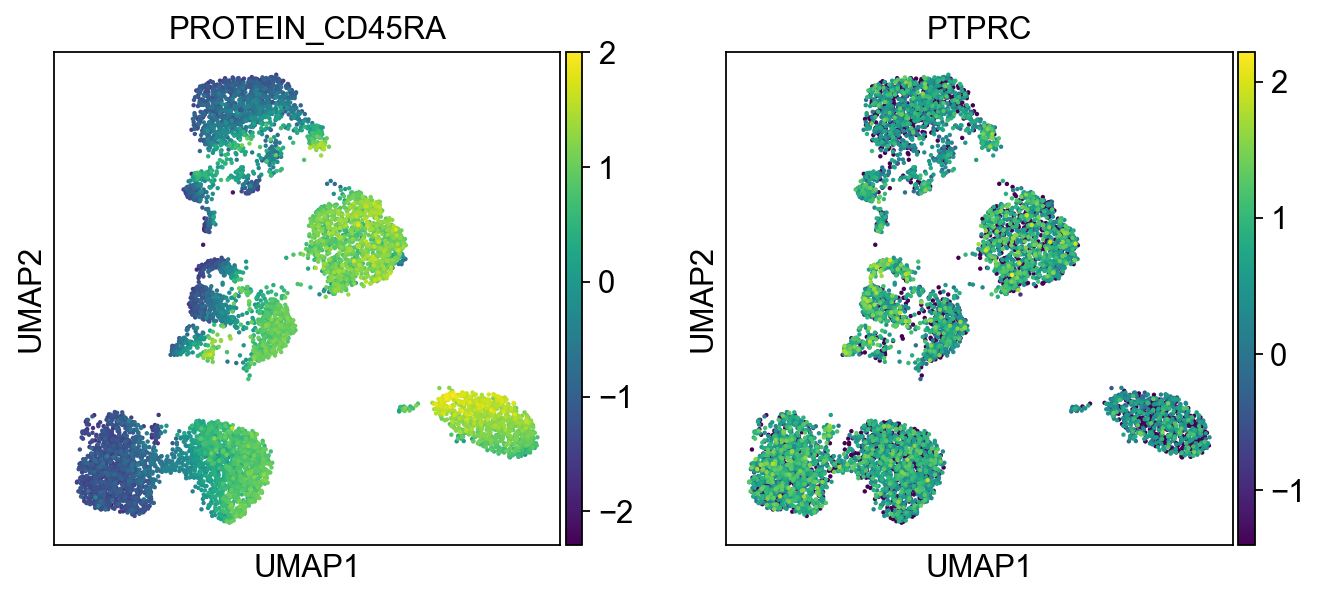
'CD19', 'PTPRC', 'CD79A', # B (CD45R = PTPRC)
'HLA-DRA', 'CD68', 'IL3RA', 'CLEC4C', 'NRP1', # DC
'CXCL9', 'CXCL10', 'CD86'
], ncols=3, legend_loc="on data", legend_fontsize=8.)
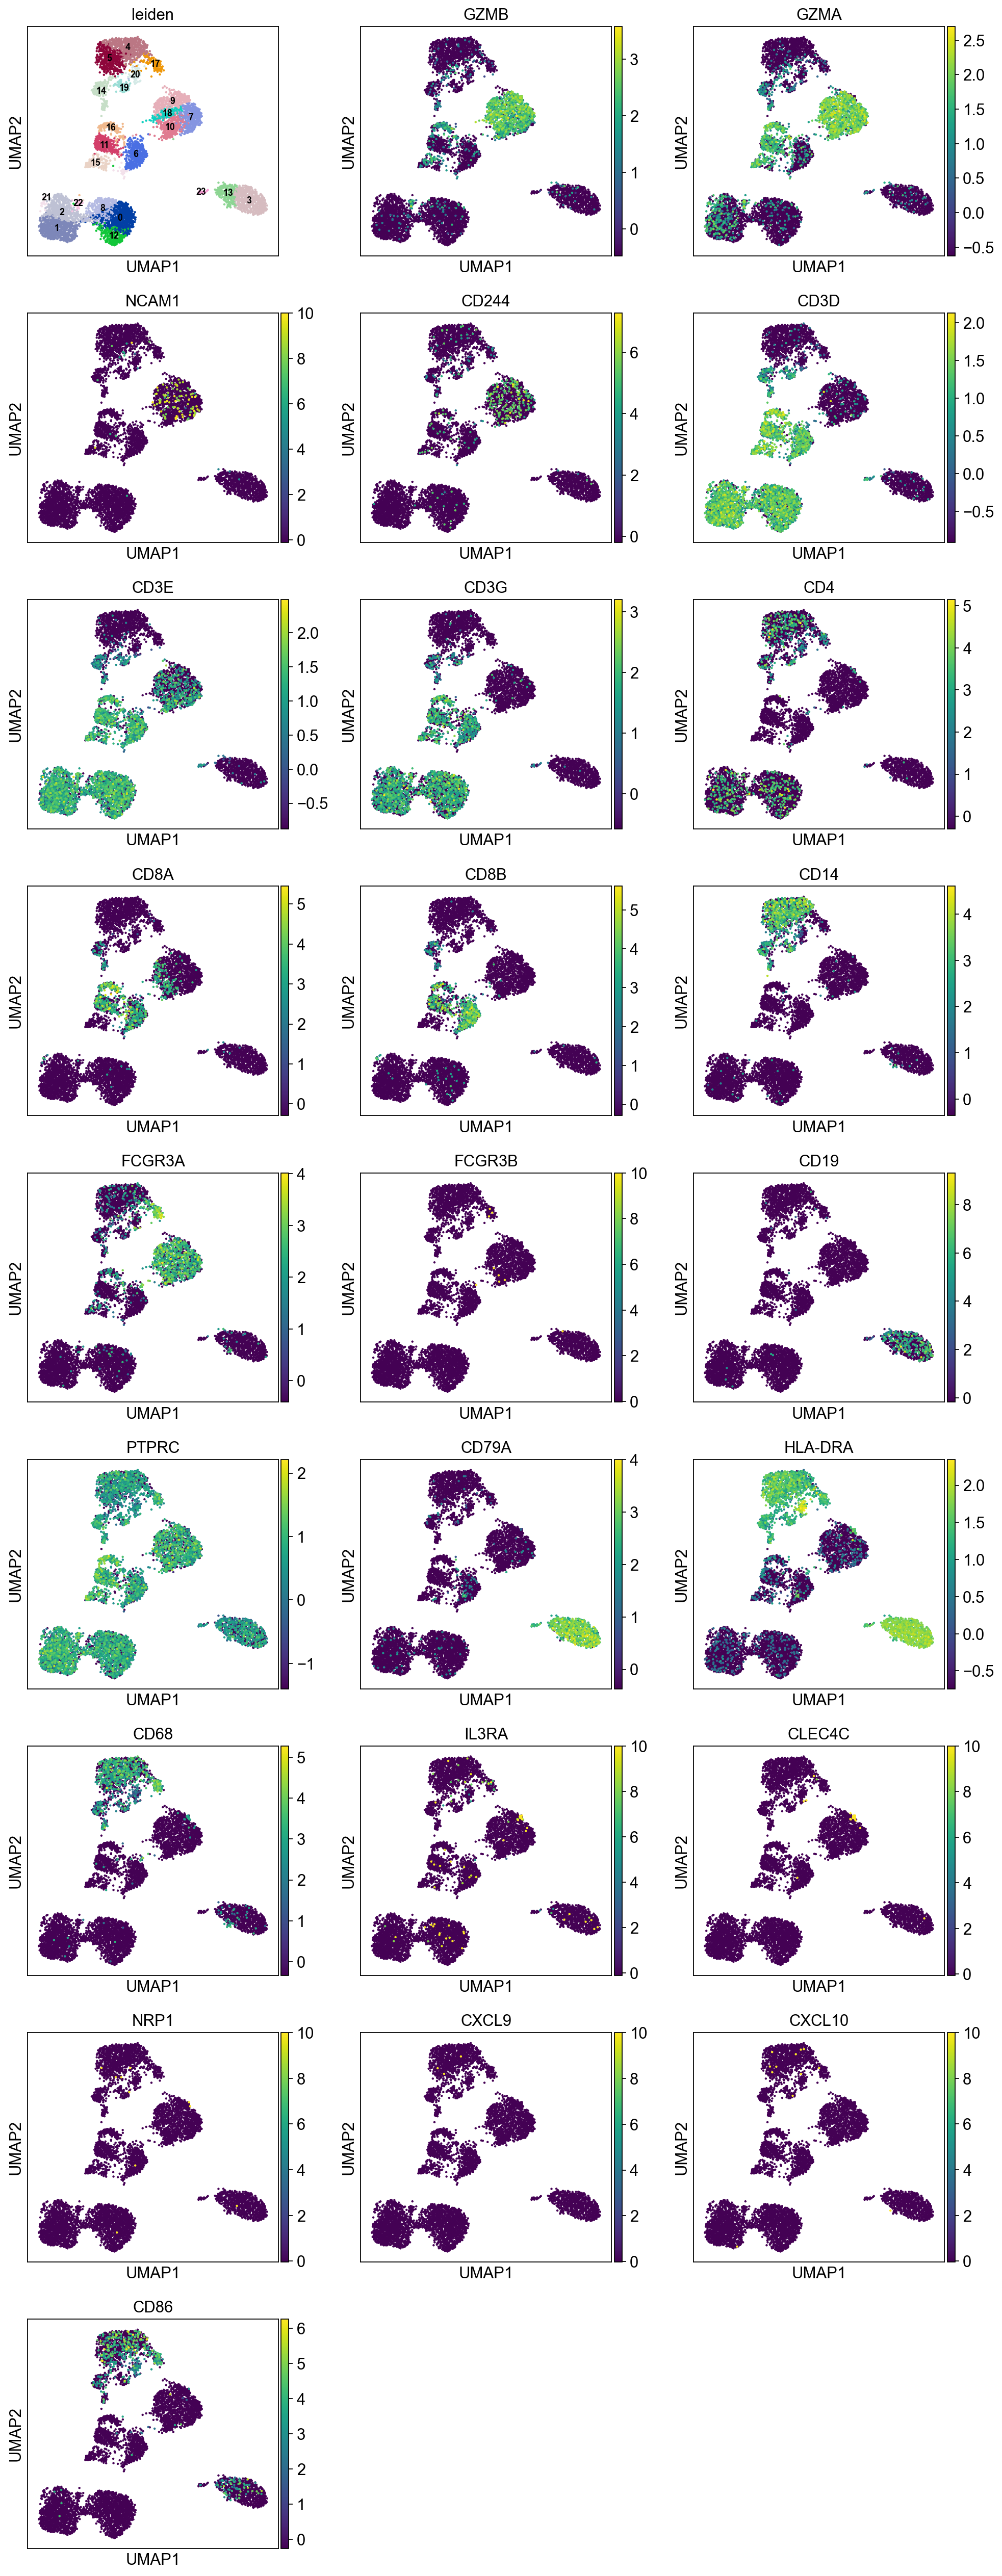
B cells:
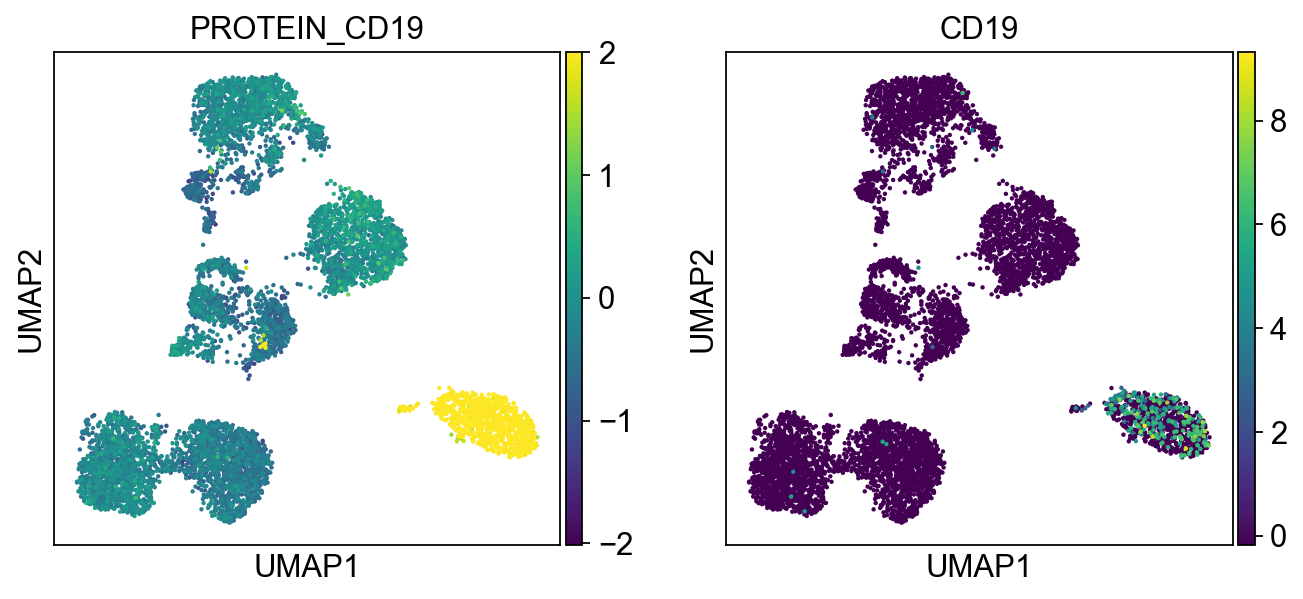
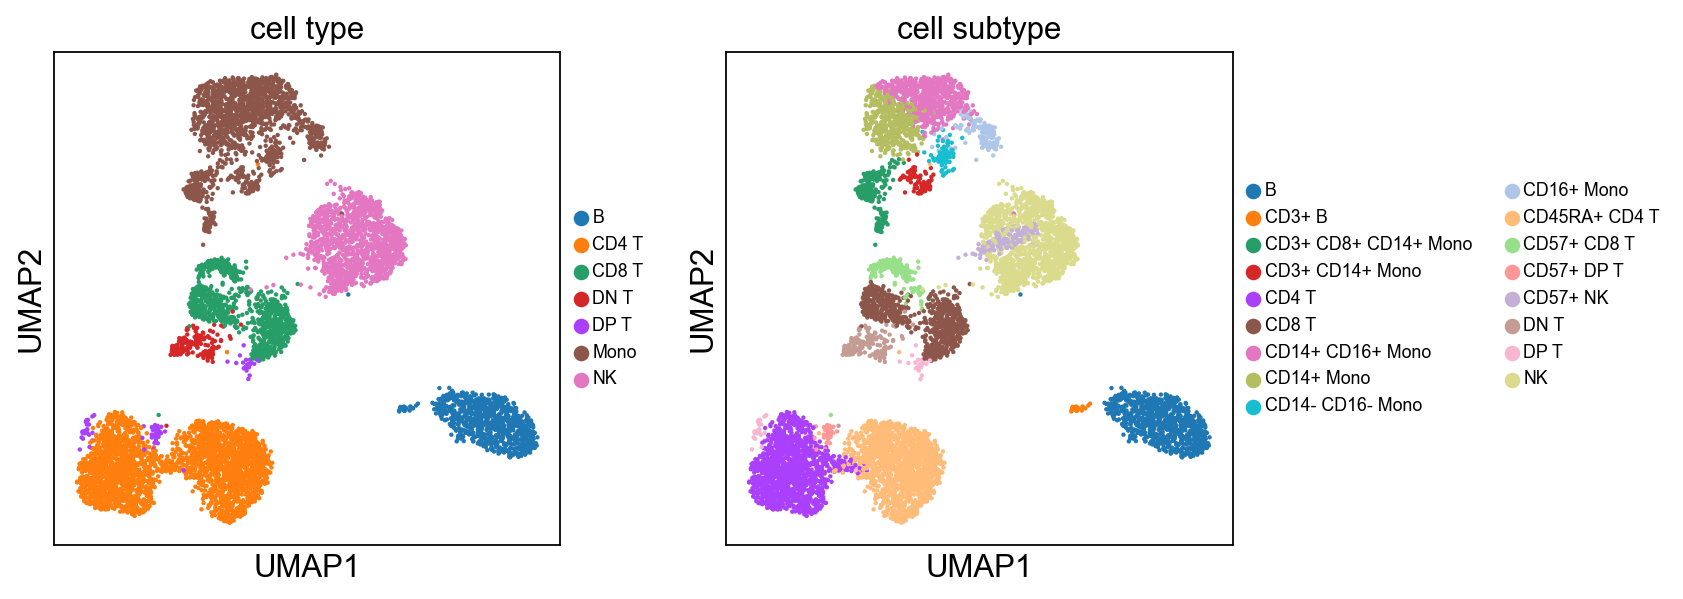
Cluster 3, 13, and 23 are classified as B cells given high CD19 expression in protein, and high CD19 and CD79A in mRNA. Because cluster 23 also has high expression of CD3, and thus is annotated as “CD3+” B cells.
T cells:
Cluster 0, 1, 2, 8, 9, 12, 21, 22 (bottom left) and cluster 6, 11, 15, 16 are clearly high in CD3, and are all T-cells. Cluster 0, 1, 2, 8, 9, 12 are CD4 T cells; Cluster 6, 11, 16 are CD8 T cells; Cluster 21, 22 are CD4+ CD8+ (double positive) T cells, labeled as DP T; CD22 is also high in CD57 Cluster 15 are CD4- CD8- (double negative) T cells, labeled as DN T;
NK cells:
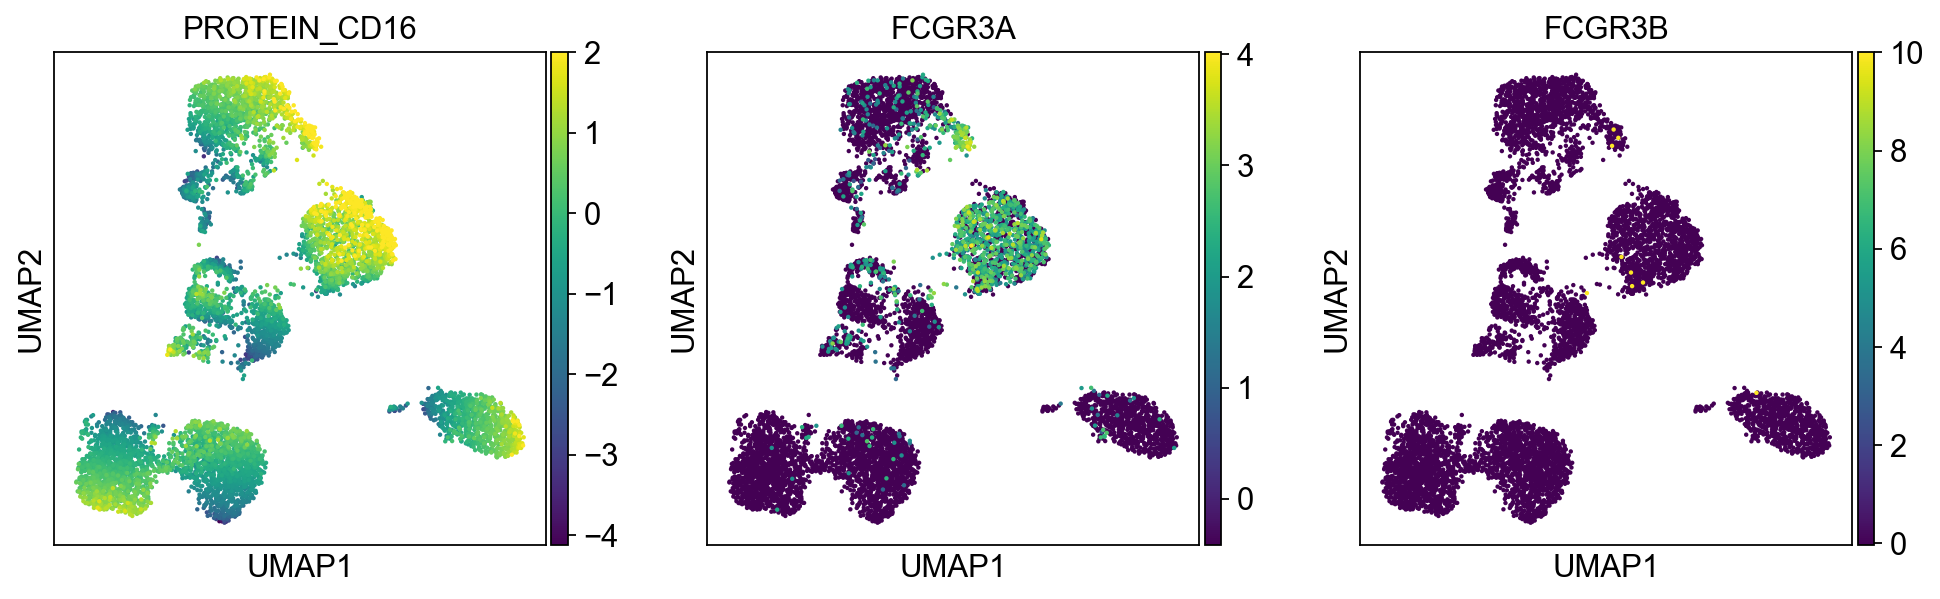
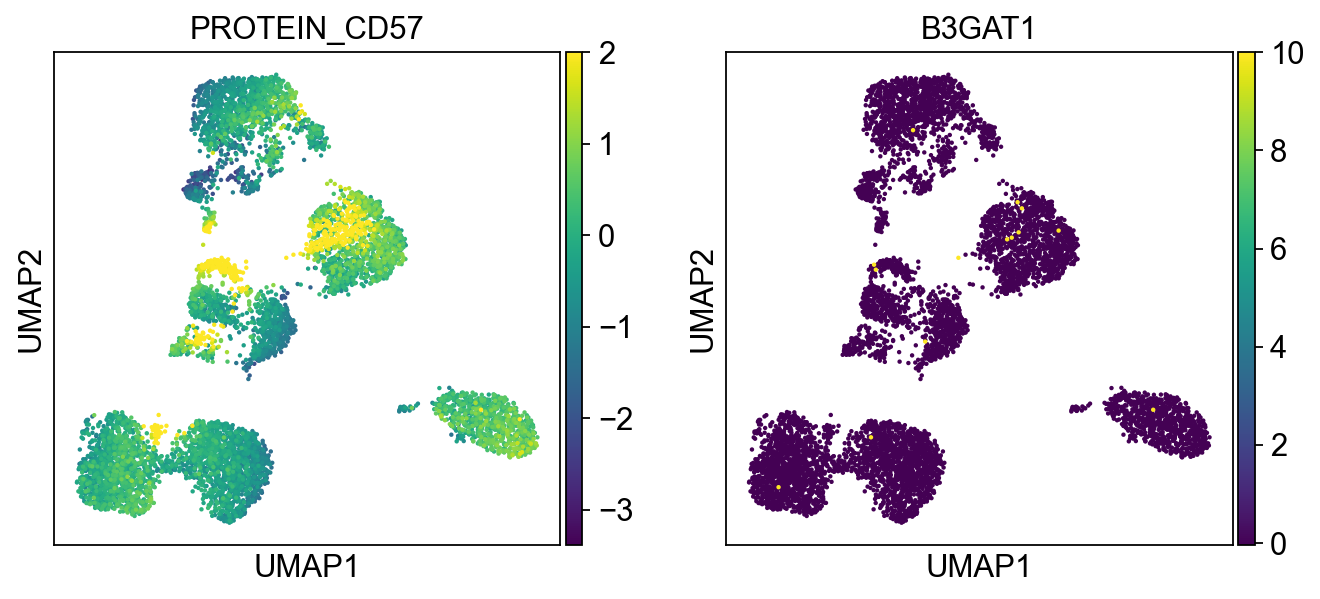
Cluster 7, 9, 10, 18 are high in CD16, GZMA/B, NCAM1 (CD56), and CD244. Cluster 18 is high in CD57.
Monocytes:
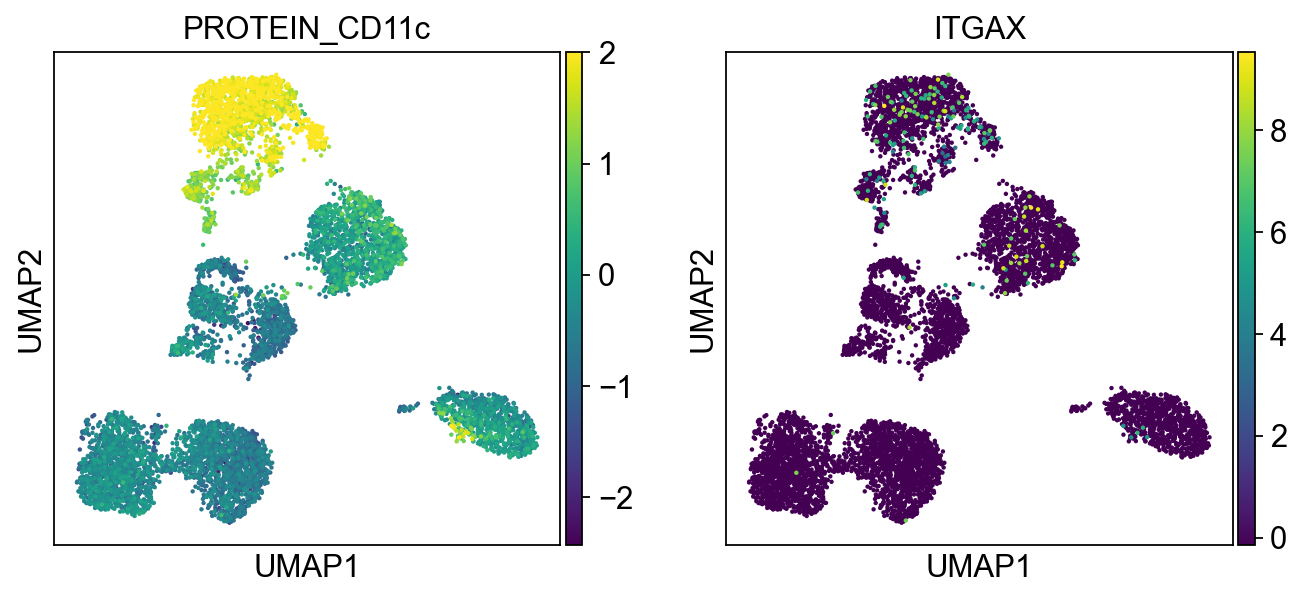
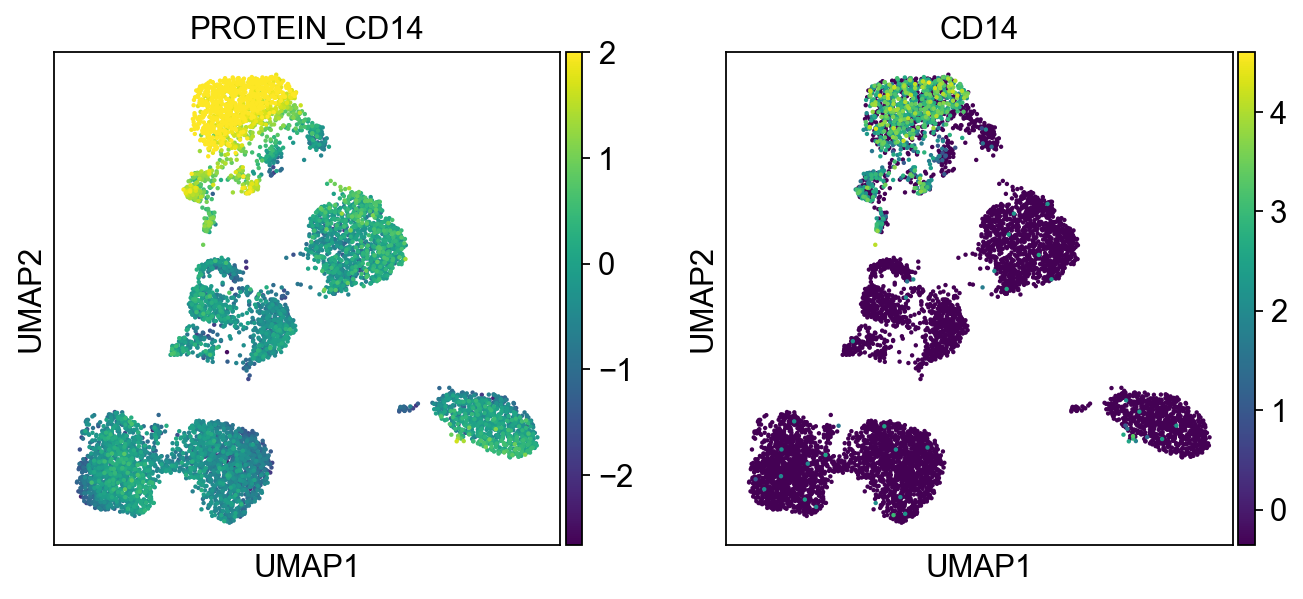
Cluster 4, 5, 14, 19, 20, 17 are high in CD11c and CD68 Cluster 4, 5, 14, 19 are high in CD14 Cluster 14 are high in CD8
[22]:
cluster2subtype = {'0': 'CD45RA+ CD4 T',
                '1': 'CD4 T',
                '2': 'CD4 T',
                '3': 'B',
                '4': 'CD14+ CD16+ Mono',
                '5': 'CD14+ Mono',
                '6': 'CD8 T',
                '7': 'NK',
                '8': 'CD45RA+ CD4 T',
                '9': 'NK',
                '10': 'NK',
                '11': 'CD8 T',
                '12': 'CD45RA+ CD4 T',
                '13': 'B',
                '14': 'CD3+ CD8+ CD14+ Mono',
                '15': 'DN T',
                '16': 'CD57+ CD8 T',
                '17': 'CD16+ Mono',
                '18': 'CD57+ NK',
                '19': 'CD3+ CD14+ Mono',
                '20': 'CD14- CD16- Mono',
                '21': 'DP T',
                '22': 'CD57+ DP T',
                '23': 'CD3+ B'}

adata.obs['cell subtype'] = [cluster2subtype[i] for i in adata.obs.leiden]
filtered_adata.obs['cell subtype'] = [cluster2subtype[i] for i in adata.obs.leiden]
merged_adata.obs['cell subtype'] = [cluster2subtype[i] for i in adata.obs.leiden]

cluster2type = {'0': 'CD4 T',
                '1': 'CD4 T',
                '2': 'CD4 T',
                '3': 'B',
                '4': 'Mono',
                '5': 'Mono',
                '6': 'CD8 T',
                '7': 'NK',
                '8': 'CD4 T',
                '9': 'NK',
                '10': 'NK',
                '11': 'CD8 T',
                '12': 'CD4 T',
                '13': 'B',
                '14': 'Mono',
                '15': 'DN T',
                '16': 'CD8 T',
                '17': 'Mono',
                '18': 'NK',
                '19': 'Mono',
                '20': 'Mono',
                '21': 'DP T',
                '22': 'DP T',
                '23': 'B'}

adata.obs['cell type'] = [cluster2type[i] for i in adata.obs.leiden]
filtered_adata.obs['cell type'] = [cluster2type[i] for i in adata.obs.leiden]
merged_adata.obs['cell type'] = [cluster2type[i] for i in adata.obs.leiden]
[23]:
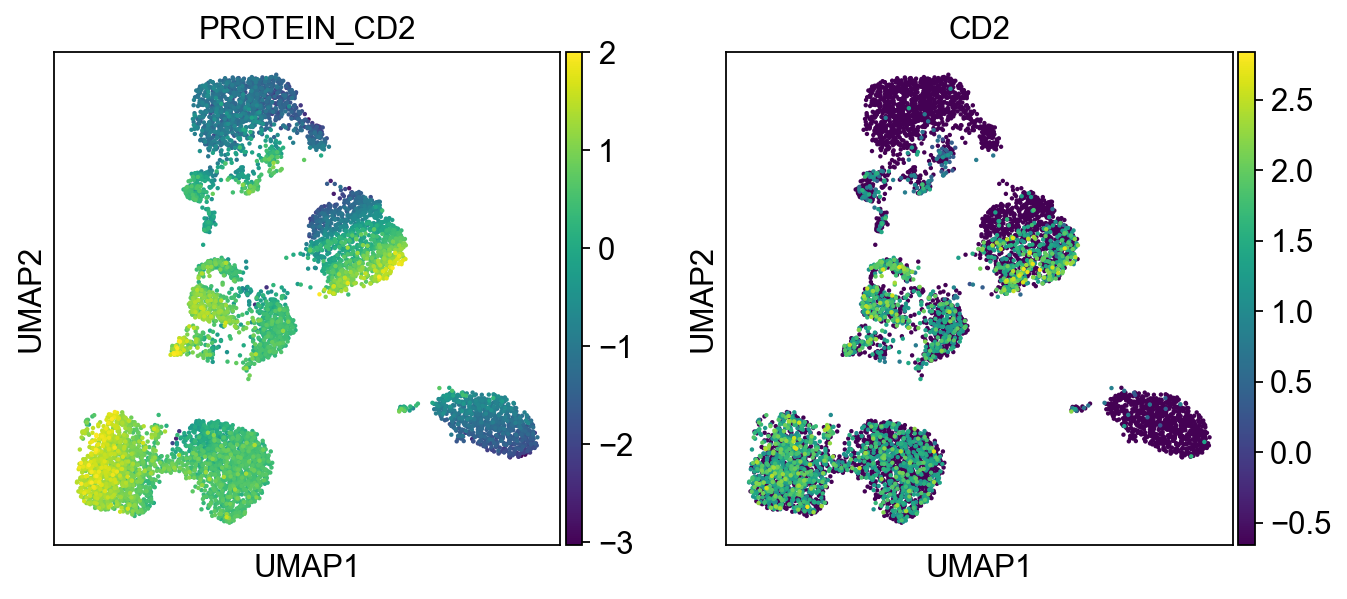
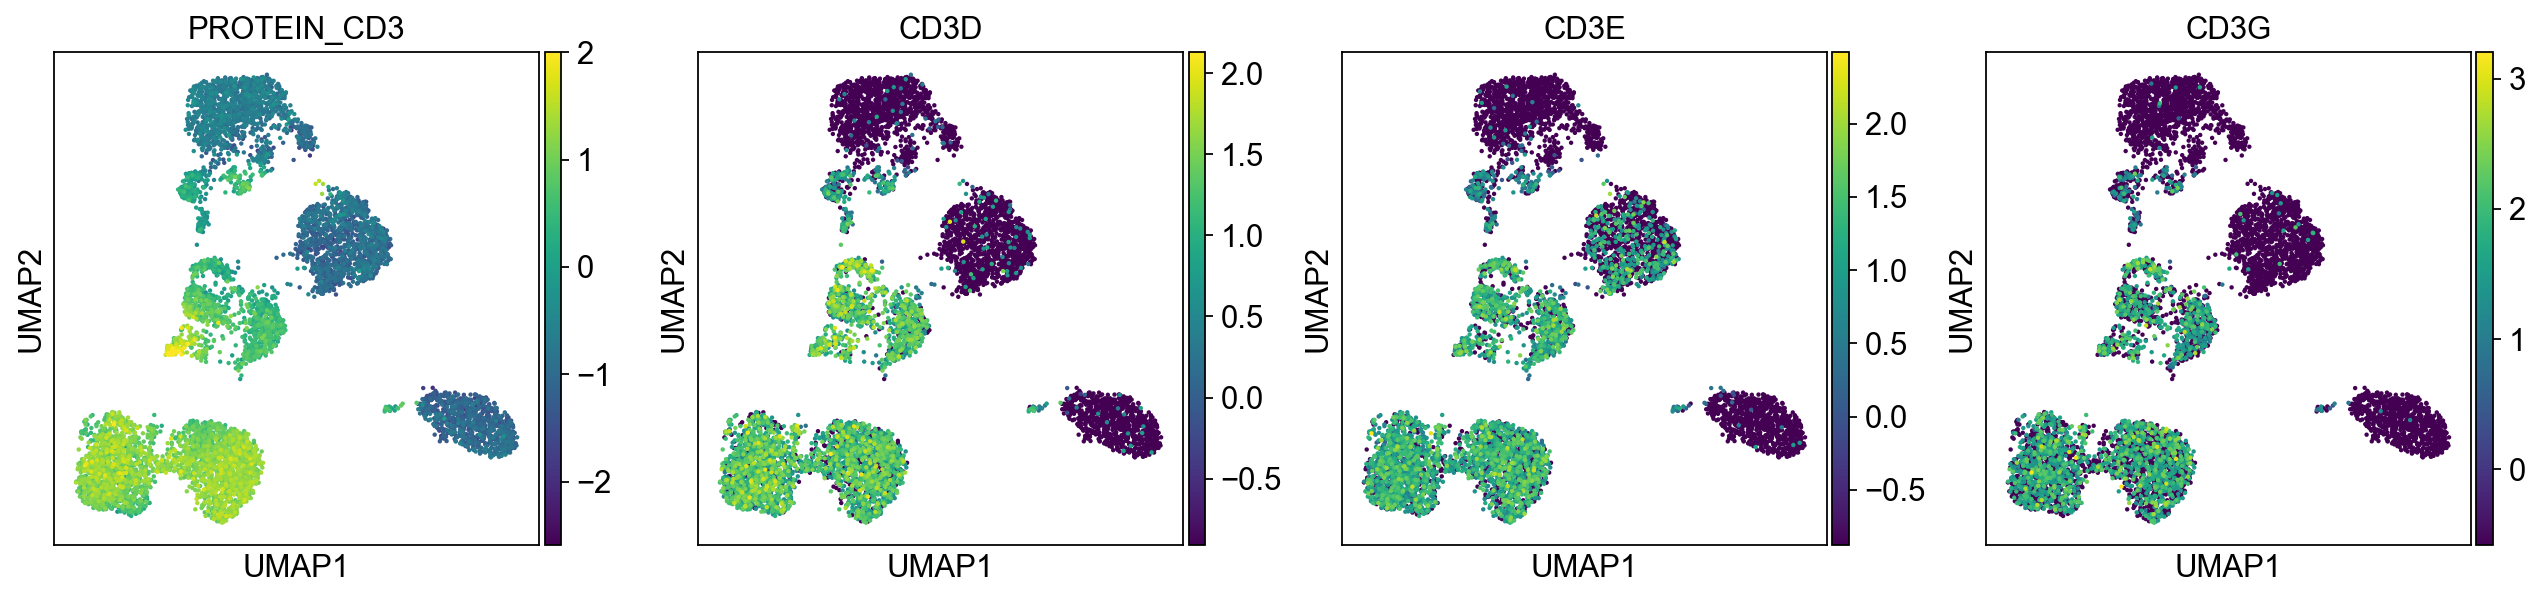
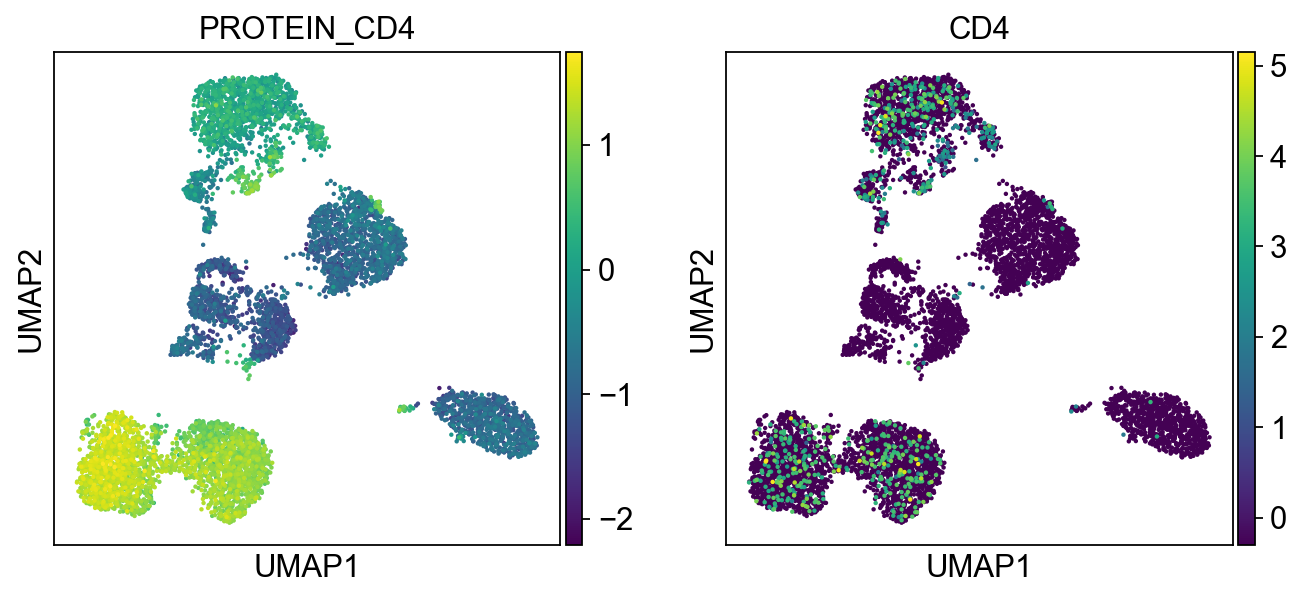
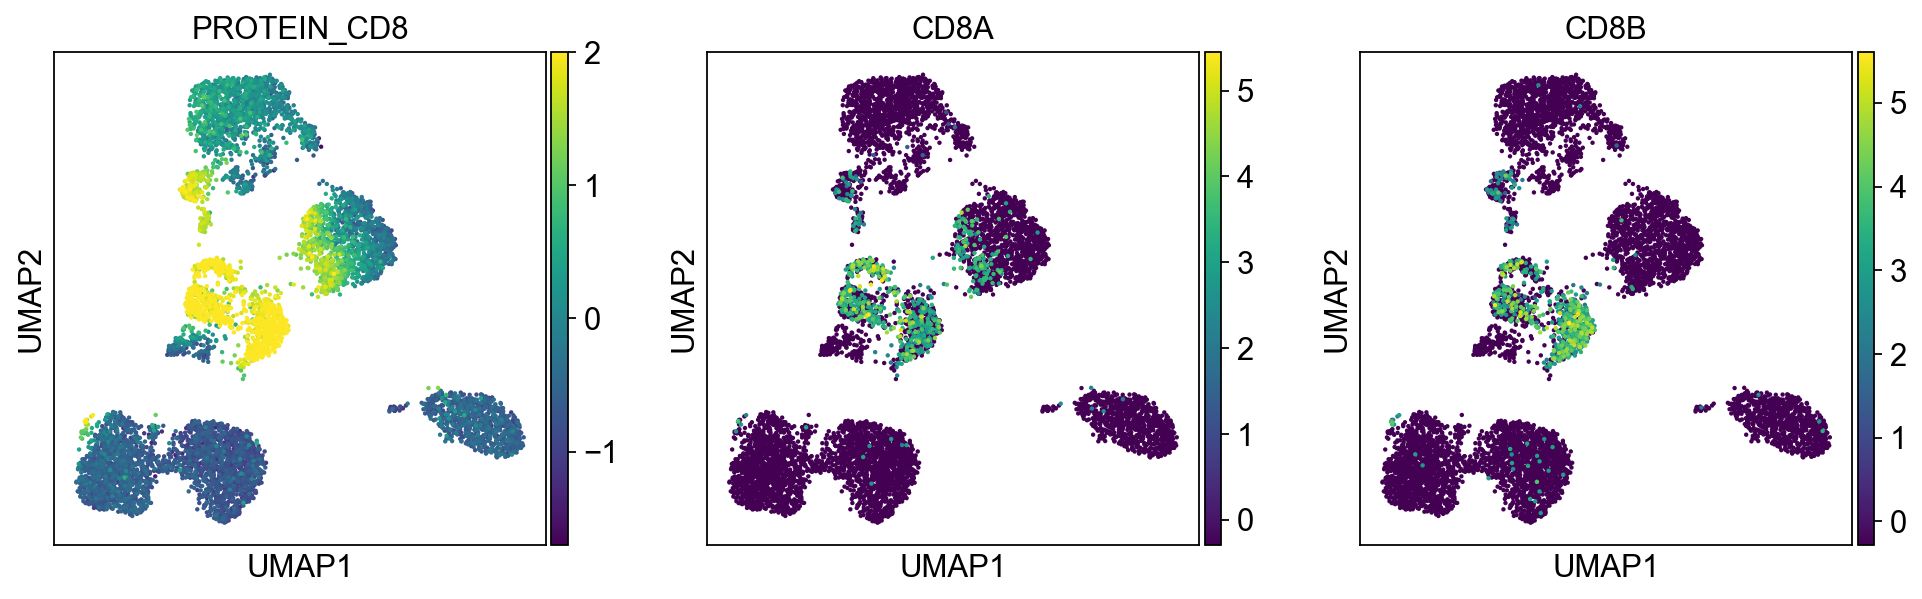
protein2rna = {'PROTEIN_CD2': ['CD2'],
               'PROTEIN_CD3': ['CD3D', 'CD3E', 'CD3G'],
               'PROTEIN_CD4': ['CD4'],
               'PROTEIN_CD8': ['CD8A', 'CD8B'],
               'PROTEIN_CD11c': ['ITGAX'],
               'PROTEIN_CD14': ['CD14'],
               'PROTEIN_CD16': ['FCGR3A', 'FCGR3B'],
               'PROTEIN_CD19': ['CD19'],
               'PROTEIN_CD45RA': ['PTPRC'],
               'PROTEIN_CD57': ['B3GAT1']
              }
for k, v in protein2rna.items():
    sc.pl.umap(merged_adata, color=[k] + v, ncols=4, legend_fontsize=8.)
C:\Users\SLiang3\Miniconda3\envs\scanpy37\lib\site-packages\anndata\_core\anndata.py:1192: FutureWarning: is_categorical is deprecated and will be removed in a future version.  Use is_categorical_dtype instead
  if is_string_dtype(df[key]) and not is_categorical(df[key])
... storing 'cell subtype' as categorical
... storing 'cell type' as categorical
[24]:
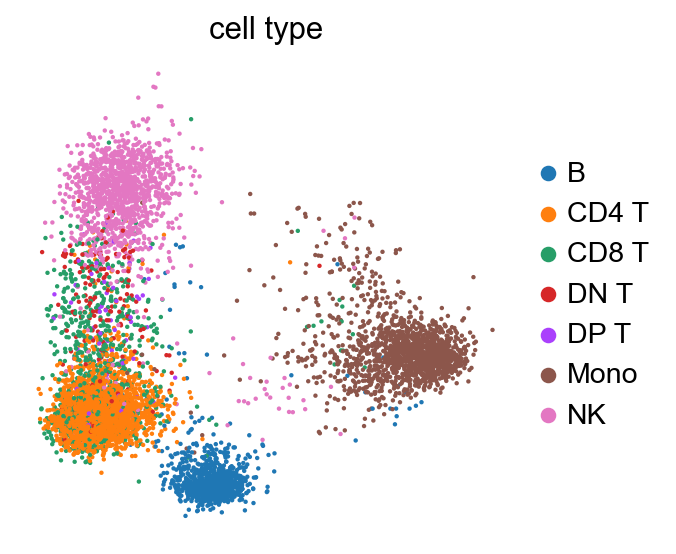
sc.pl.umap(adata, color=['cell type', 'cell subtype'], ncols=4, legend_fontsize=8.)
... storing 'cell subtype' as categorical
... storing 'cell type' as categorical
[25]:
#import sys
#sys.path.insert(0,'..')
#import compactmarker._tsne_l1
#np.random.seed(0)
#model = compactmarker._tsne_l1.TsneL1.tune(50, rna_adata.X, filtered_adata.X) # , max_inner_iter=1, max_outer_iter=1
[26]:
#np.random.seed(0)
#model = compactmarker._tsne_l1.TsneL1.tune(50, rna_adata.X, filtered_adata.X,
#                                           min_lasso=1.2409377607517196e-05, max_lasso=1.539926526059492e-05)
#import torch
#torch.autograd.set_detect_anomaly(True)
[39]:
import sys
sys.path.insert(0,'..')
import compactmarker

model = compactmarker.UmapL1(lasso=1e-3, ridge=1e-3, n_pcs=None, perplexity=100., use_beta_in_Q=True, n_threads=6,
                             max_outer_iter=2) # , max_inner_iter=1, max_outer_iter=1
model.fit(rna_adata.X, X_teacher=filtered_adata.X)
Calculating distance matrix and scaling factors...
Computing pairwise distances...
Using 6 threads...
Mean value of sigma: 0.362250
Done. Elapsed time: 61.17 seconds. Total: 61.17 seconds.
Creating model without batches...
Optimizing using OWLQN (because lasso is nonzero)...
0 loss: 38.25368118286133 Nonzero: 69 Elapsed time: 472.48 seconds. Total: 533.65 seconds.
1 loss: 3.821220874786377 Nonzero: 69 Elapsed time: 278.84 seconds. Total: 812.49 seconds.
final loss: 3.8009145259857178 Nonzero: 69 Elapsed time: 6.67 seconds. Total: 819.16 seconds.
[39]:
<compactmarker._umap_l1.UmapL1 at 0x1c99fc46a08>
[45]:
import sys
sys.path.insert(0,'..')
import compactmarker

model = compactmarker.UmapL1(lasso=5e-4, ridge=0., n_pcs=None, perplexity=100., use_beta_in_Q=True, n_threads=6,
                             max_outer_iter=2) # , max_inner_iter=1, max_outer_iter=1
model.fit(rna_adata.X, X_teacher=filtered_adata.X)
Calculating distance matrix and scaling factors...
Computing pairwise distances...
Using 6 threads...
Mean value of sigma: 0.362250
Done. Elapsed time: 56.94 seconds. Total: 56.94 seconds.
Creating model without batches...
Optimizing using OWLQN (because lasso is nonzero)...
0 loss: 12.995180130004883 Nonzero: 27 Elapsed time: 468.43 seconds. Total: 525.37 seconds.
1 loss: 3.8472976684570312 Nonzero: 26 Elapsed time: 461.75 seconds. Total: 987.12 seconds.
final loss: 3.816372871398926 Nonzero: 26 Elapsed time: 6.67 seconds. Total: 993.79 seconds.
[45]:
<compactmarker._umap_l1.UmapL1 at 0x1c99fdf4088>
[46]:
print(*rna_adata.var_names[model.get_mask()])
AIF1 CD7 CD74 CD79A CD8B CST7 CTSS FCER1G GNLY HLA-DPA1 HLA-DRA HLA-DRB1 IL32 LEF1 LGALS1 LST1 LYZ NKG7 PRF1 RPL13 S100A11 S100A4 S100A8 S100A9 TRBC2 TYROBP
[47]:
rnas = rna_adata.raw.var.index.to_series().apply(lambda x: '' + x).tolist()
merged_adata2 = rna_adata.copy()

protein_markers = ['PROTEIN_' + i for i in filtered_adata.var.index]

for i, marker in enumerate(filtered_adata.var.index.tolist()):
    merged_adata2.obs['PROTEIN_' + marker] = filtered_adata.X[:, i]
[48]:
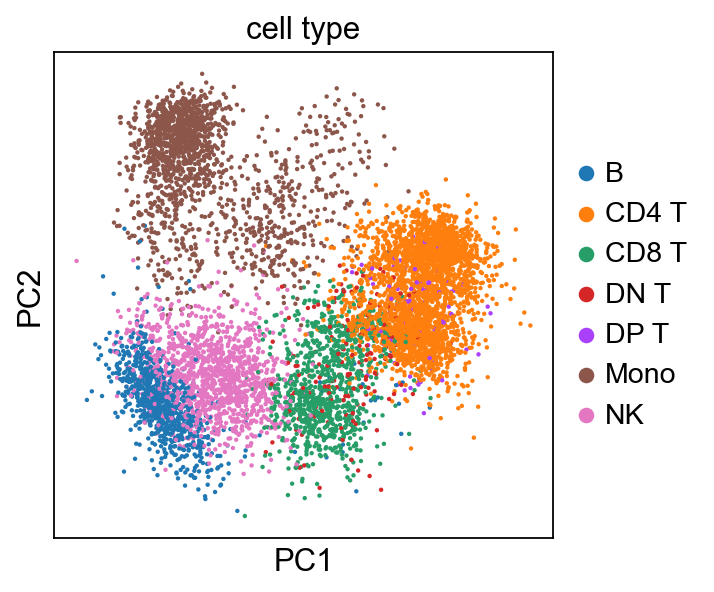
sc.pl.pca(adata, color='cell type')
[51]:
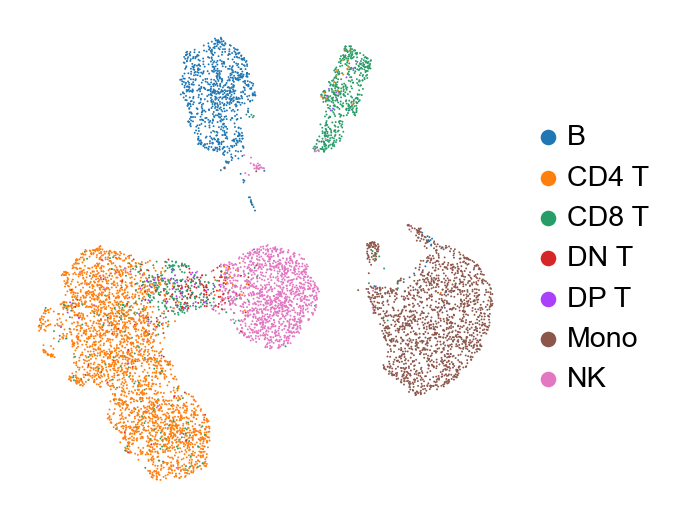
new_adata = model.transform(merged_adata2.copy())
new_adata.obs['cell type'] = filtered_adata.obs['cell type']
new_adata.obs['cell subtype'] = filtered_adata.obs['cell subtype']

sc.tl.pca(new_adata, svd_solver='arpack')
sc.pl.pca(new_adata, color='cell type', frameon=False)
sc.pp.neighbors(new_adata, n_pcs=5, use_rep="X_pca")
sc.tl.umap(new_adata)

sc.pl.umap(new_adata, color=['cell type'], frameon=False, title="", size=3.)
C:\Users\SLiang3\Miniconda3\envs\scanpy37\lib\site-packages\anndata\_core\anndata.py:1094: FutureWarning: is_categorical is deprecated and will be removed in a future version.  Use is_categorical_dtype instead
  if not is_categorical(df_full[k]):
Trying to set attribute `.obs` of view, copying.
computing PCA
    on highly variable genes
    with n_comps=24
    finished (0:00:00)
computing neighbors
    finished: added to `.uns['neighbors']`
    `.obsp['distances']`, distances for each pair of neighbors
    `.obsp['connectivities']`, weighted adjacency matrix (0:00:01)
computing UMAP
    finished: added
    'X_umap', UMAP coordinates (adata.obsm) (0:00:09)
[ ]:
[32]:
new_adata
[32]:
AnnData object with n_obs × n_vars = 7634 × 48
    obs: 'cell subtype', 'cell type', 'n_genes', 'n_genes_by_counts', 'total_counts', 'total_counts_mt', 'pct_counts_mt', 'leiden', 'PROTEIN_CD3', 'PROTEIN_CD4', 'PROTEIN_CD8', 'PROTEIN_CD2', 'PROTEIN_CD45RA', 'PROTEIN_CD57', 'PROTEIN_CD16', 'PROTEIN_CD14', 'PROTEIN_CD11c', 'PROTEIN_CD19'
    var: 'n_cells', 'mt', 'n_cells_by_counts', 'mean_counts', 'pct_dropout_by_counts', 'total_counts', 'highly_variable', 'means', 'dispersions', 'dispersions_norm', 'mean', 'std'
    uns: 'cell subtype_colors', 'cell type_colors', 'hvg', 'leiden', 'leiden_colors', 'neighbors', 'pca', 'umap'
    obsm: 'X_pca', 'X_umap'
    varm: 'PCs'
    obsp: 'connectivities', 'distances'
[33]:
import pandas as pd
import seaborn as sn
import matplotlib.pyplot as plt
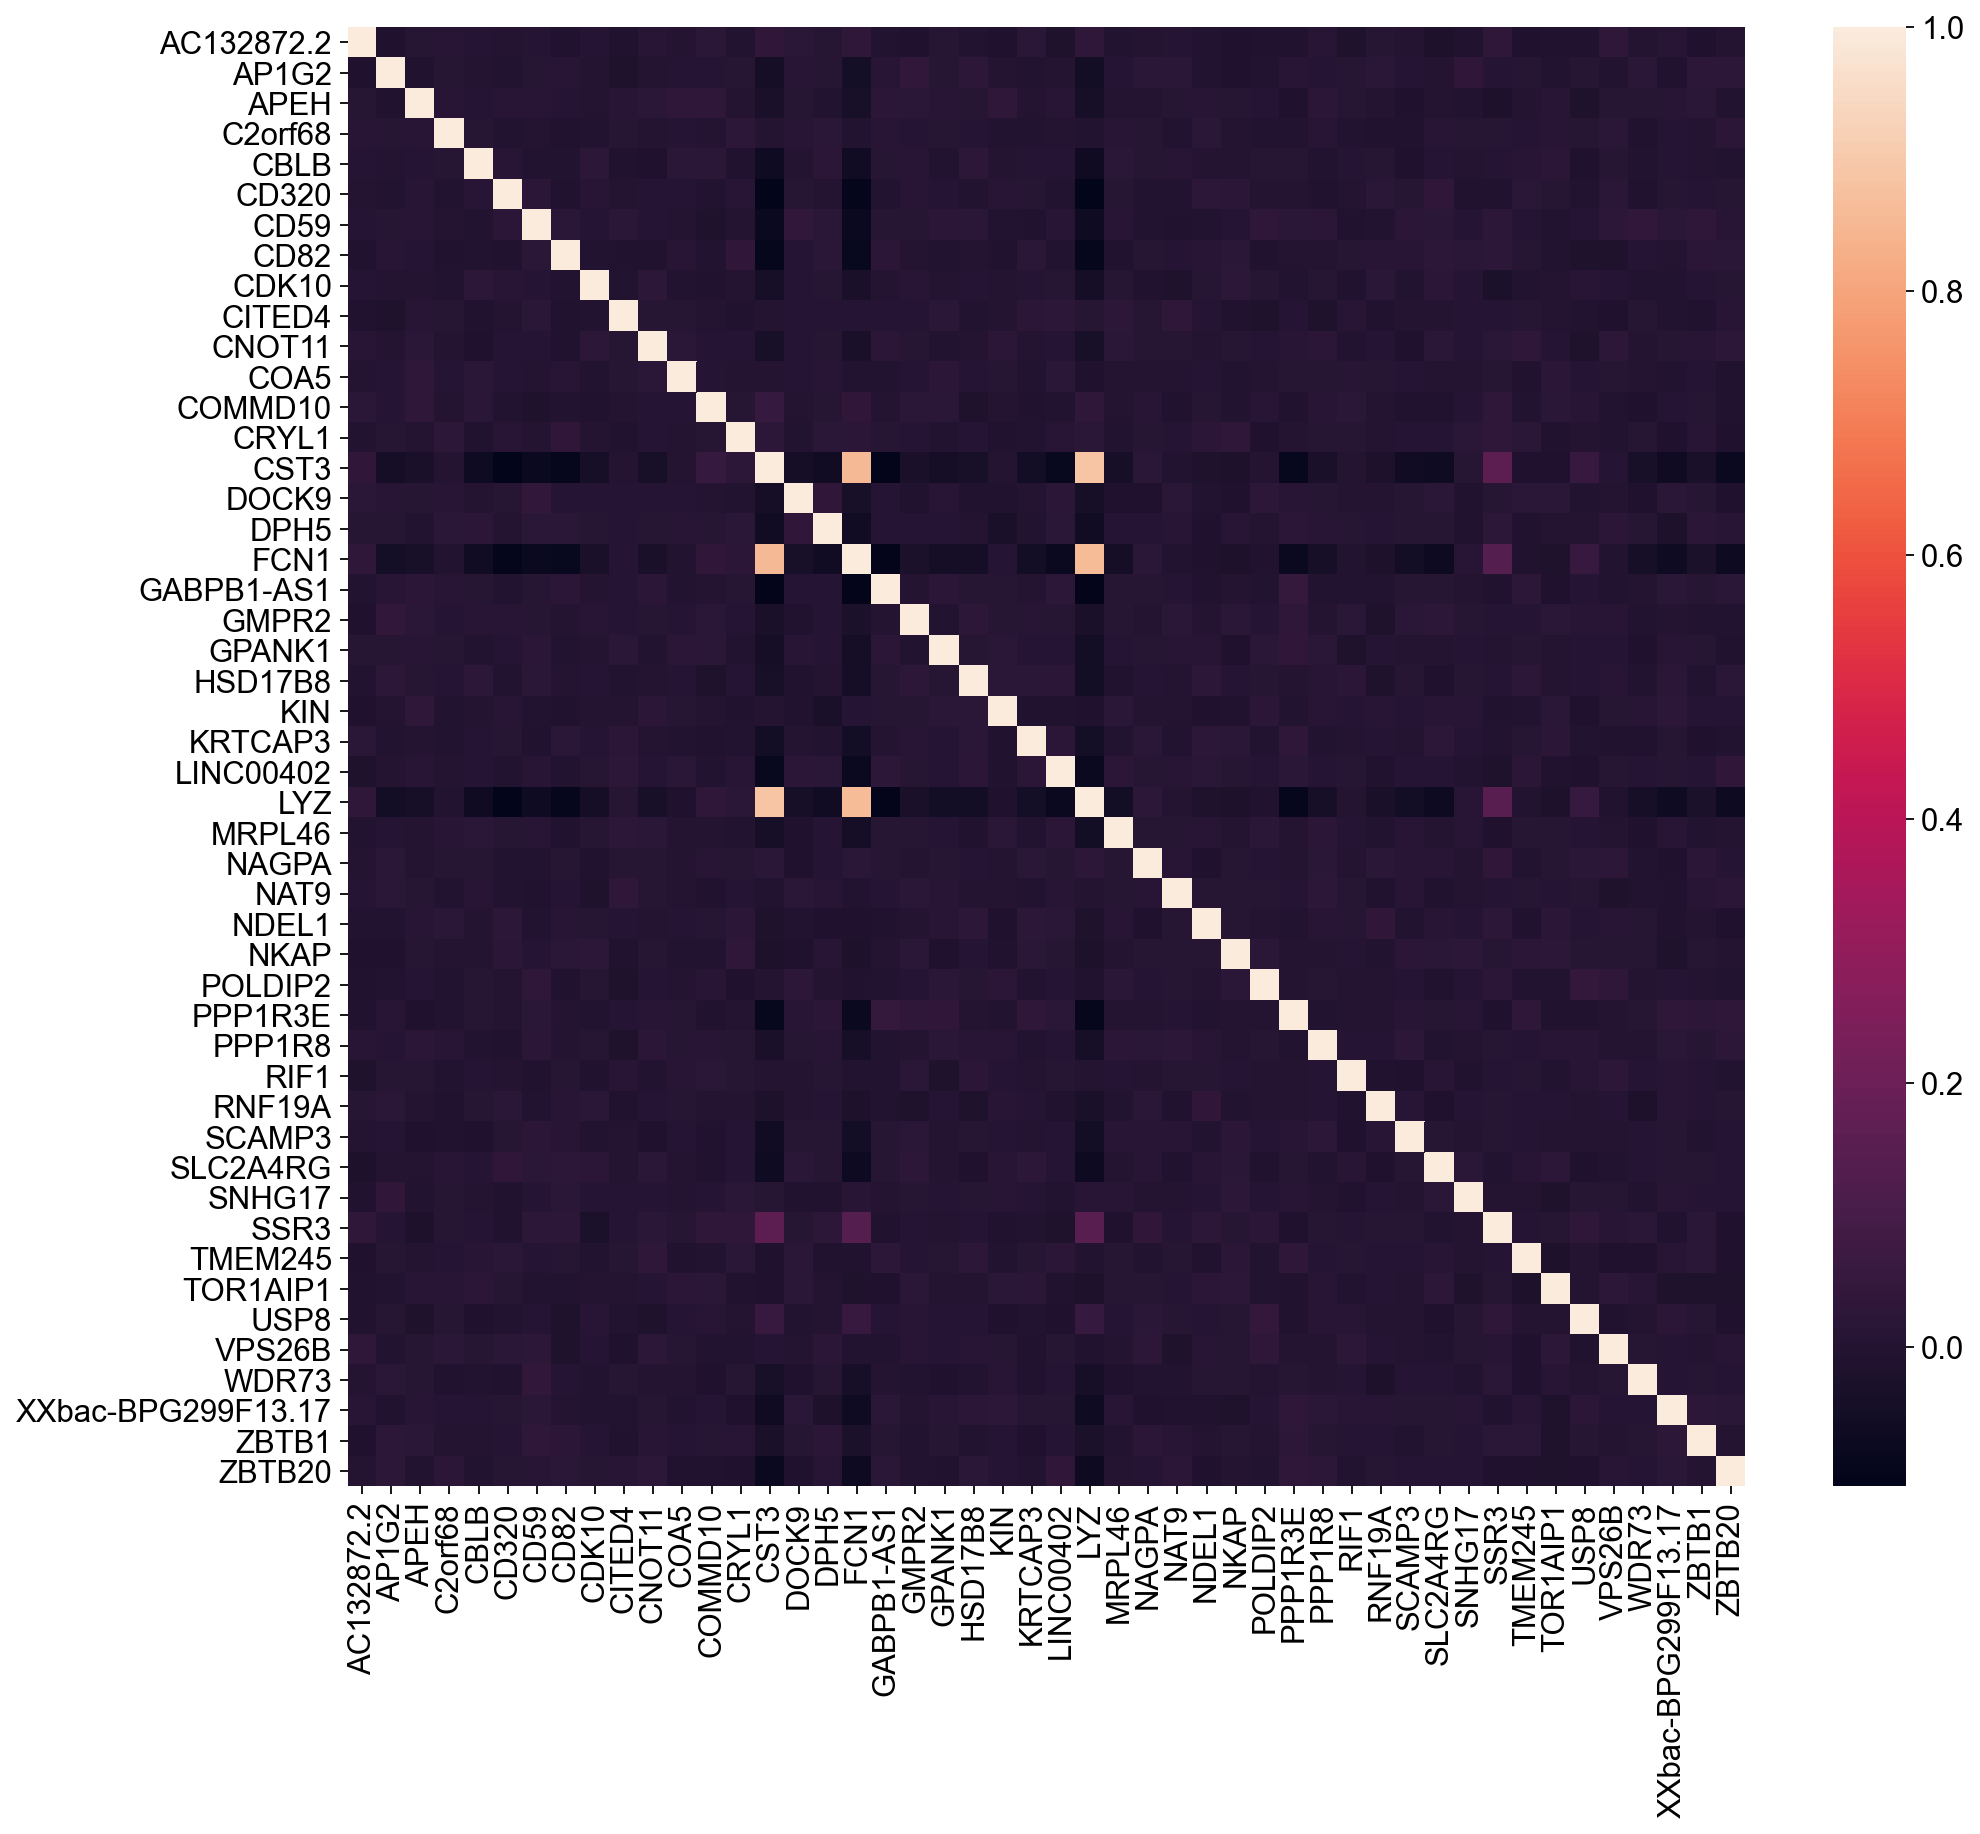
df = pd.DataFrame(new_adata.X, columns=new_adata.var.index)
corrMatrix = df.corr()
fig, ax = plt.subplots(figsize=(14, 12))
sn.heatmap(ax=ax, data=corrMatrix, xticklabels=True, yticklabels=True)
plt.show()
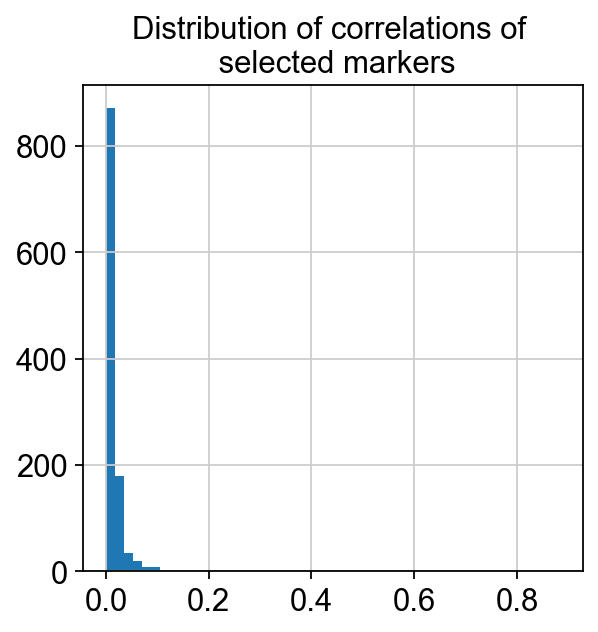
corr_matrix = corrMatrix.values
corr_matrix = np.abs(corr_matrix)
corr_values = []
for i in range(corr_matrix.shape[0]):
for j in range(i):
corr_values.append(corr_matrix[i, j])
plt.hist(corr_values, bins=50)
plt.title('Distribution of correlations of \n selected markers')
[33]:
Text(0.5, 1.0, 'Distribution of correlations of \n selected markers')
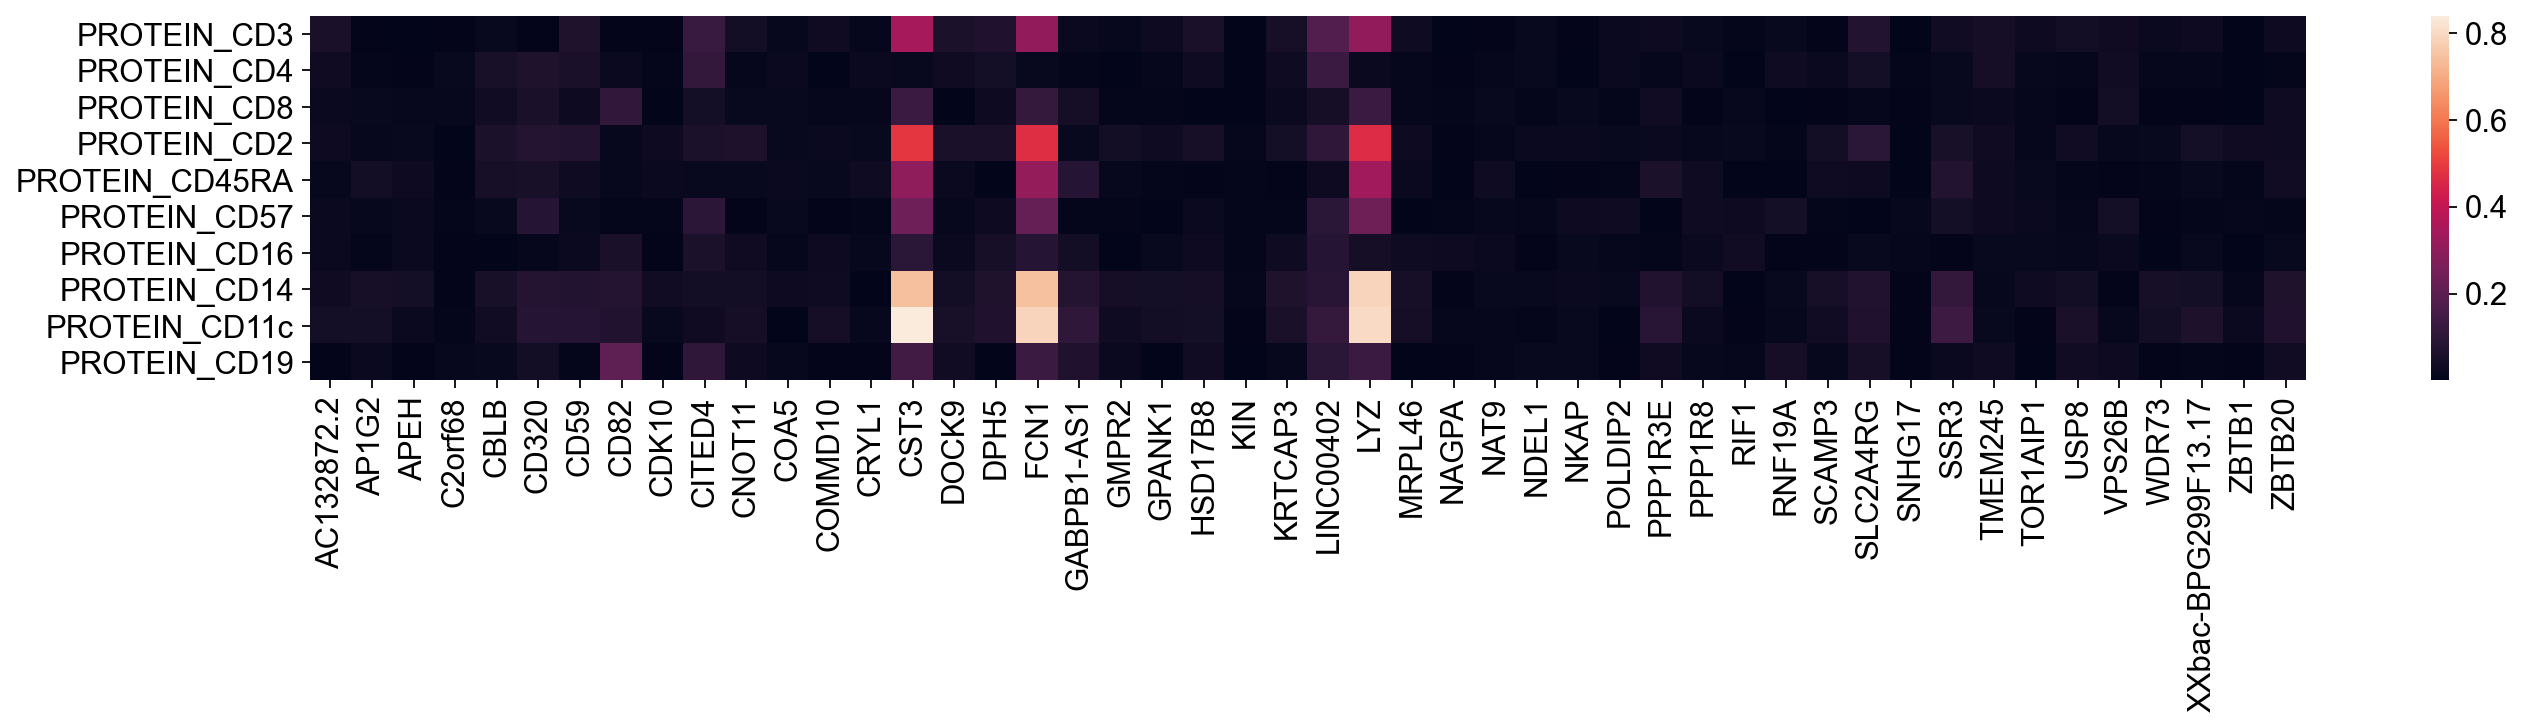
[34]:
import pandas as pd
import seaborn as sn
import matplotlib.pyplot as plt

df2 = pd.concat([df.reset_index(drop=True),
                new_adata.obs.loc[:, new_adata.obs.columns.str.contains('PROTEIN_')].reset_index(drop=True)],
               axis=1)

corrMatrix = df2.corr()
corrMatrix = corrMatrix.loc[corrMatrix.index.str.contains('PROTEIN_'), ~corrMatrix.index.str.contains('PROTEIN_')]

fig, ax = plt.subplots(figsize=(20, 3))
sn.heatmap(ax=ax, data=corrMatrix.abs(), xticklabels=True, yticklabels=True)
plt.show()
[35]:
corrMatrix.T.style
[35]:
| PROTEIN_CD3 | PROTEIN_CD4 | PROTEIN_CD8 | PROTEIN_CD2 | PROTEIN_CD45RA | PROTEIN_CD57 | PROTEIN_CD16 | PROTEIN_CD14 | PROTEIN_CD11c | PROTEIN_CD19 | |
|---|---|---|---|---|---|---|---|---|---|---|
| AC132872.2 | -0.057121 | -0.033678 | 0.022242 | -0.026684 | 0.015539 | 0.021639 | 0.023311 | 0.033757 | 0.043185 | 0.003818 |
| AP1G2 | 0.003806 | -0.007512 | -0.019456 | 0.014663 | 0.041407 | 0.014168 | -0.009372 | -0.050276 | -0.045060 | 0.024469 |
| APEH | -0.001326 | 0.003457 | -0.013882 | 0.018534 | 0.027218 | 0.025875 | 0.024947 | -0.045393 | -0.023549 | -0.005811 |
| C2orf68 | 0.004219 | 0.018819 | -0.013954 | -0.001032 | 0.005328 | -0.008308 | 0.006165 | -0.006577 | 0.008854 | -0.013827 |
| CBLB | -0.017304 | -0.055466 | 0.036698 | 0.061028 | 0.052467 | 0.016983 | -0.003008 | -0.053712 | -0.036736 | -0.016574 |
| CD320 | -0.004388 | -0.068123 | 0.056684 | 0.080928 | 0.054757 | 0.083013 | 0.011571 | -0.081302 | -0.082888 | -0.041756 |
| CD59 | 0.067997 | 0.059027 | -0.028081 | 0.077722 | -0.031213 | 0.019404 | -0.022022 | -0.075959 | -0.082218 | -0.006978 |
| CD82 | -0.006573 | 0.022886 | -0.110960 | 0.015401 | 0.015857 | 0.007061 | -0.057523 | -0.079809 | -0.074393 | 0.204989 |
| CDK10 | -0.005229 | -0.007795 | -0.001334 | 0.029529 | 0.023666 | 0.009640 | 0.004888 | -0.038625 | -0.018294 | -0.003952 |
| CITED4 | 0.124631 | 0.112310 | -0.043116 | 0.060291 | -0.018634 | -0.096972 | -0.061113 | -0.042644 | -0.035454 | -0.102378 |
| CNOT11 | 0.039936 | 0.013133 | 0.017130 | 0.063803 | -0.016901 | 0.004260 | -0.033437 | -0.041727 | -0.046556 | -0.027419 |
| COA5 | -0.014229 | -0.025784 | 0.018401 | -0.018384 | 0.020379 | 0.017014 | 0.010107 | -0.028425 | 0.002627 | 0.014582 |
| COMMD10 | -0.034393 | -0.001196 | 0.013050 | -0.026152 | -0.017461 | 0.003855 | 0.027445 | 0.030550 | 0.045945 | -0.006138 |
| CRYL1 | 0.010003 | 0.021328 | -0.011779 | 0.018476 | -0.029595 | -0.007285 | -0.013955 | -0.000704 | 0.013180 | -0.005122 |
| CST3 | -0.345264 | 0.019570 | 0.130521 | -0.486025 | -0.304183 | -0.238582 | 0.095101 | 0.742058 | 0.839373 | -0.144727 |
| DOCK9 | 0.060252 | 0.034208 | 0.003071 | 0.057710 | -0.021485 | -0.014831 | -0.020848 | -0.042459 | -0.054808 | -0.037967 |
| DPH5 | 0.069149 | 0.042724 | -0.026671 | 0.057574 | 0.000370 | -0.028330 | -0.049750 | -0.068381 | -0.070880 | 0.000552 |
| FCN1 | -0.306816 | 0.018249 | 0.116456 | -0.469859 | -0.314470 | -0.221331 | 0.084627 | 0.744712 | 0.788196 | -0.128639 |
| GABPB1-AS1 | 0.022763 | -0.007434 | -0.047978 | 0.018762 | 0.082215 | 0.009561 | -0.039467 | -0.081629 | -0.101957 | 0.070178 |
| GMPR2 | 0.015361 | 0.001043 | 0.007426 | 0.040610 | 0.016050 | 0.009150 | 0.003124 | -0.046416 | -0.031352 | -0.025418 |
| GPANK1 | 0.027088 | 0.012442 | -0.007912 | 0.029707 | 0.008911 | 0.001101 | -0.018153 | -0.044393 | -0.041172 | 0.003045 |
| HSD17B8 | 0.057555 | 0.031551 | -0.001858 | 0.051736 | -0.003797 | -0.025695 | -0.028289 | -0.048395 | -0.042747 | -0.037324 |
| KIN | -0.001901 | -0.001338 | -0.001949 | 0.010628 | -0.007908 | 0.009455 | 0.009179 | -0.011014 | 0.005309 | -0.001850 |
| KRTCAP3 | 0.050297 | 0.032055 | -0.023494 | 0.043469 | -0.006392 | -0.008872 | -0.030755 | -0.066973 | -0.058224 | 0.015308 |
| LINC00402 | 0.179249 | 0.128856 | -0.048477 | 0.104298 | -0.028654 | -0.092499 | -0.083487 | -0.091408 | -0.115161 | -0.092257 |
| LYZ | -0.308150 | 0.020707 | 0.129248 | -0.467036 | -0.335649 | -0.235306 | 0.047670 | 0.787555 | 0.802407 | -0.130433 |
| MRPL46 | 0.031722 | 0.012419 | -0.010568 | 0.029103 | 0.023233 | -0.001981 | -0.029543 | -0.052403 | -0.048489 | -0.001838 |
| NAGPA | -0.001235 | 0.005049 | -0.009468 | -0.003438 | -0.000618 | 0.007869 | -0.027073 | 0.004224 | 0.011885 | 0.005165 |
| NAT9 | 0.003746 | 0.010192 | -0.018497 | -0.010489 | 0.031342 | -0.014602 | -0.019943 | -0.018622 | -0.010718 | 0.011342 |
| NDEL1 | 0.018304 | 0.016491 | -0.009681 | 0.026141 | -0.001764 | -0.012347 | -0.003363 | -0.017089 | -0.008624 | -0.018704 |
| NKAP | -0.005028 | 0.001098 | -0.017527 | 0.023260 | -0.005454 | 0.029372 | 0.017674 | -0.025580 | -0.016604 | 0.019324 |
| POLDIP2 | -0.022635 | -0.022624 | 0.006805 | 0.018742 | 0.009673 | 0.030947 | 0.012325 | -0.018104 | 0.000050 | 0.005588 |
| PPP1R3E | 0.027233 | 0.010902 | -0.037340 | 0.022627 | 0.062267 | -0.001434 | -0.007526 | -0.074333 | -0.089508 | 0.035120 |
| PPP1R8 | -0.017425 | -0.025874 | 0.005143 | 0.013556 | 0.032592 | 0.031551 | 0.020002 | -0.039399 | -0.025948 | 0.014832 |
| RIF1 | 0.008047 | -0.000676 | 0.015667 | 0.017868 | -0.001064 | -0.029437 | -0.036240 | -0.000438 | -0.003309 | -0.011216 |
| RNF19A | -0.016699 | -0.031279 | -0.001289 | 0.006751 | 0.003266 | 0.043778 | -0.003904 | -0.017940 | -0.016350 | 0.047477 |
| SCAMP3 | -0.004628 | -0.025407 | 0.004629 | 0.040217 | 0.030370 | 0.009009 | -0.005542 | -0.050580 | -0.036885 | 0.015669 |
| SLC2A4RG | 0.078483 | 0.045201 | -0.011598 | 0.094449 | -0.026786 | 0.000995 | -0.018170 | -0.074844 | -0.070343 | -0.051508 |
| SNHG17 | 0.002901 | 0.009197 | 0.003716 | 0.002854 | -0.001650 | -0.014684 | -0.011865 | 0.006123 | -0.005473 | -0.005647 |
| SSR3 | -0.039209 | 0.017750 | 0.017859 | -0.052679 | -0.077998 | -0.042835 | -0.003835 | 0.113954 | 0.137226 | -0.023115 |
| TMEM245 | 0.049015 | 0.048746 | -0.021178 | 0.034155 | -0.026393 | -0.028445 | -0.017854 | -0.013756 | -0.017335 | -0.030610 |
| TOR1AIP1 | -0.026530 | -0.013282 | 0.010001 | 0.011240 | 0.017378 | 0.025602 | 0.017205 | -0.030057 | -0.006080 | 0.002709 |
| USP8 | -0.040339 | -0.012659 | -0.003770 | -0.038324 | -0.007250 | -0.011114 | -0.013279 | 0.040626 | 0.057500 | 0.036300 |
| VPS26B | -0.034631 | -0.038457 | 0.040399 | 0.013927 | 0.006315 | 0.045906 | 0.025707 | -0.006399 | 0.013654 | -0.029259 |
| WDR73 | 0.026131 | 0.010095 | -0.005092 | 0.018848 | 0.009678 | -0.004826 | 0.002599 | -0.049521 | -0.041935 | 0.003765 |
| XXbac-BPG299F13.17 | 0.029379 | -0.009988 | 0.004856 | 0.043457 | 0.017339 | -0.006785 | -0.018289 | -0.042830 | -0.064013 | 0.008200 |
| ZBTB1 | 0.000205 | 0.000028 | 0.001345 | 0.034133 | -0.008531 | 0.012861 | 0.000149 | -0.010494 | -0.022030 | 0.003472 |
| ZBTB20 | 0.028594 | 0.006783 | -0.031892 | 0.030955 | 0.036300 | 0.007254 | -0.019074 | -0.066323 | -0.070462 | 0.036235 |
[36]:
print(*(i for i in corrMatrix.T.index))
AC132872.2 AP1G2 APEH C2orf68 CBLB CD320 CD59 CD82 CDK10 CITED4 CNOT11 COA5 COMMD10 CRYL1 CST3 DOCK9 DPH5 FCN1 GABPB1-AS1 GMPR2 GPANK1 HSD17B8 KIN KRTCAP3 LINC00402 LYZ MRPL46 NAGPA NAT9 NDEL1 NKAP POLDIP2 PPP1R3E PPP1R8 RIF1 RNF19A SCAMP3 SLC2A4RG SNHG17 SSR3 TMEM245 TOR1AIP1 USP8 VPS26B WDR73 XXbac-BPG299F13.17 ZBTB1 ZBTB20
[37]:
adata.obs.to_csv("../../CITE-seq/human-pbmc-cell.csv")
[52]:
weight_df = pd.DataFrame(model.w[model.w > 0.], index=rna_adata.var_names[model.w > 0.])
weight_df.to_pickle("cite-seq-26-weights.pkl")
weight_df.to_csv("cite-seq-26-weigths.csv")
[56]:
merged_adata.write_loom("cite-seq.loom")
The loom file will lack these fields:
{'X_umap', 'X_pca'}
Use write_obsm_varm=True to export multi-dimensional annotations