PBMC CITE-Seq RNA Processing
[1]:
import scanpy as sc
import os
import pandas as pd
import numpy as np
import pickle as pkl
import matplotlib as mpl
import matplotlib.pyplot as plt
import scipy.stats

sc.settings.verbosity = 3
[2]:
data = pd.read_csv("../../CITE-seq/GSE100866_PBMC_vs_flow_10X-RNA_umi.csv", index_col=0)
data.head()
[2]:
| ACCGTAAGTGTAATGA | CGTGAGCTCGAGAACG | CACATTTAGAATTCCC | TACGGTATCTGGGCCA | TCAGGTAGTAAGTTCC | TGATTTCGTTCTCATT | ACACTGAAGGCCCTCA | ACGGGTCGTCACACGC | AGCTTGACATCCCATC | ACGTCAATCCGTCATC | ... | TTCTCCTAGATCGATA | GGAAAGCGTCGACTAT | GACTAACCAACACCCG | AGCGTCGTCCTCGCAT | TCTCATAAGTTTGCGT | GTCGGGTAGAGCTGGT | GTCGGGTAGGTAGCCA | GTCGGGTAGTCTTGCA | ATGTGTGGTCCGTTAA | CGTATGCCGTCTTCTG | |
|---|---|---|---|---|---|---|---|---|---|---|---|---|---|---|---|---|---|---|---|---|---|
| HUMAN_A1BG | 0 | 0 | 0 | 0 | 0 | 0 | 0 | 0 | 0 | 0 | ... | 0 | 0 | 0 | 0 | 0 | 0 | 0 | 0 | 0 | 0 |
| HUMAN_A1BG-AS1 | 0 | 0 | 0 | 0 | 0 | 0 | 0 | 0 | 0 | 0 | ... | 0 | 0 | 0 | 0 | 0 | 0 | 0 | 0 | 0 | 0 |
| HUMAN_A2M | 0 | 0 | 0 | 0 | 0 | 0 | 0 | 0 | 0 | 0 | ... | 0 | 0 | 0 | 0 | 0 | 0 | 0 | 0 | 0 | 0 |
| HUMAN_A2M-AS1 | 0 | 0 | 0 | 0 | 0 | 0 | 0 | 0 | 0 | 0 | ... | 0 | 2 | 0 | 0 | 0 | 0 | 0 | 0 | 0 | 0 |
| HUMAN_AAAS | 0 | 0 | 0 | 0 | 0 | 0 | 0 | 0 | 0 | 0 | ... | 0 | 0 | 0 | 0 | 0 | 1 | 0 | 0 | 0 | 0 |
5 rows × 7985 columns
[3]:
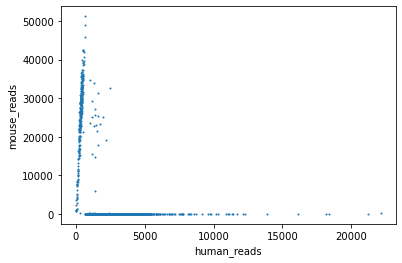
human_reads = data.loc[data.index.str.contains("HUMAN_"), :].sum(axis=0)
mouse_reads = data.loc[data.index.str.contains("MOUSE_"), :].sum(axis=0)
plt.scatter(human_reads, mouse_reads, s=1.)
plt.xlabel("human_reads")
plt.ylabel("mouse_reads")

human_cell_mask = human_reads / mouse_reads > 9
print("Number of human cells", sum(human_cell_mask))
Number of human cells 7667
[4]:
data = data.loc[data.index.str.contains("HUMAN_"), human_cell_mask]
data.index = data.index.str[6:]
[5]:
adata = sc.AnnData(data.T)
[6]:
adata
[6]:
AnnData object with n_obs × n_vars = 7667 × 17014
[7]:
adata.obs
[7]:
| TGACTAGTCCCAAGTA |
|---|
| GACCTGGAGTCTCAAC |
| GATCTAGCATTCTTAC |
| CATATGGCATCCCACT |
| CACATAGGTCTCCACT |
| ... |
| GGAAAGCGTCGACTAT |
| AGCGTCGTCCTCGCAT |
| GTCGGGTAGAGCTGGT |
| GTCGGGTAGGTAGCCA |
| GTCGGGTAGTCTTGCA |
7667 rows × 0 columns
[8]:
temp = pd.read_csv("../../CITE-seq/human-pbmc-cell.csv", index_col=0)
adata.obs['cell subtype'] = temp['cell subtype']
adata.obs['cell type'] = temp['cell type']
[9]:
sc.settings.set_figure_params(dpi=80, facecolor='white')
sc.pl.highest_expr_genes(adata, n_top=20)
normalizing counts per cell
    finished (0:00:00)

[10]:
sc.pp.filter_cells(adata, min_genes=200)
sc.pp.filter_genes(adata, min_cells=3)
C:\Users\SLiang3\Miniconda3\envs\scanpy37\lib\site-packages\anndata\_core\anndata.py:1094: FutureWarning: is_categorical is deprecated and will be removed in a future version.  Use is_categorical_dtype instead
  if not is_categorical(df_full[k]):
filtered out 175 genes that are detected in less than 3 cells
[44]:
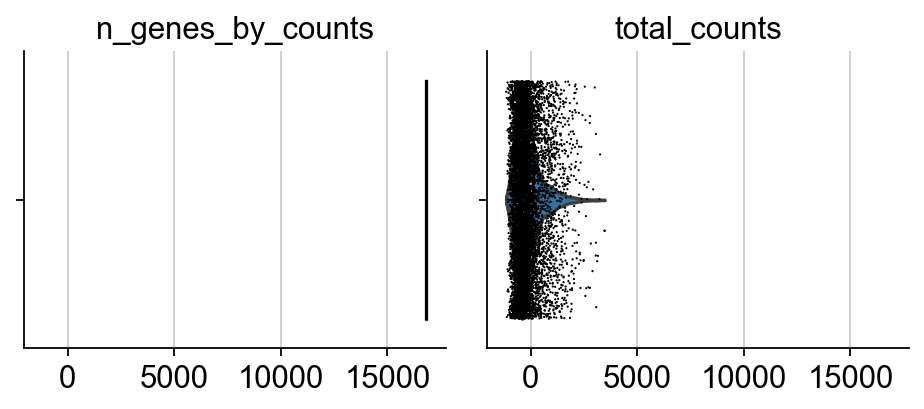
adata.var['mt'] = adata.var.index.str.startswith('MT-')  # annotate the group of mitochondrial genes as 'mt'
sc.pp.calculate_qc_metrics(adata, qc_vars=['mt'], percent_top=None, log1p=False, inplace=True)
sc.pl.violin(adata, ['n_genes_by_counts', 'total_counts'], jitter=0.4, multi_panel=True)
sc.pl.violin(adata, ['pct_counts_mt'], jitter=0.4, multi_panel=True)
C:\Users\SLiang3\Miniconda3\envs\scanpy37\lib\site-packages\seaborn\_core.py:1303: UserWarning: Vertical orientation ignored with only `x` specified.
  warnings.warn(single_var_warning.format("Vertical", "x"))
C:\Users\SLiang3\Miniconda3\envs\scanpy37\lib\site-packages\seaborn\_core.py:1303: UserWarning: Vertical orientation ignored with only `x` specified.
  warnings.warn(single_var_warning.format("Vertical", "x"))
C:\Users\SLiang3\Miniconda3\envs\scanpy37\lib\site-packages\seaborn\_core.py:1303: UserWarning: Vertical orientation ignored with only `x` specified.
  warnings.warn(single_var_warning.format("Vertical", "x"))
C:\Users\SLiang3\Miniconda3\envs\scanpy37\lib\site-packages\seaborn\_core.py:1303: UserWarning: Vertical orientation ignored with only `x` specified.
  warnings.warn(single_var_warning.format("Vertical", "x"))
C:\Users\SLiang3\Miniconda3\envs\scanpy37\lib\site-packages\seaborn\_core.py:1303: UserWarning: Vertical orientation ignored with only `x` specified.
  warnings.warn(single_var_warning.format("Vertical", "x"))
C:\Users\SLiang3\Miniconda3\envs\scanpy37\lib\site-packages\seaborn\_core.py:1303: UserWarning: Vertical orientation ignored with only `x` specified.
  warnings.warn(single_var_warning.format("Vertical", "x"))

[12]:
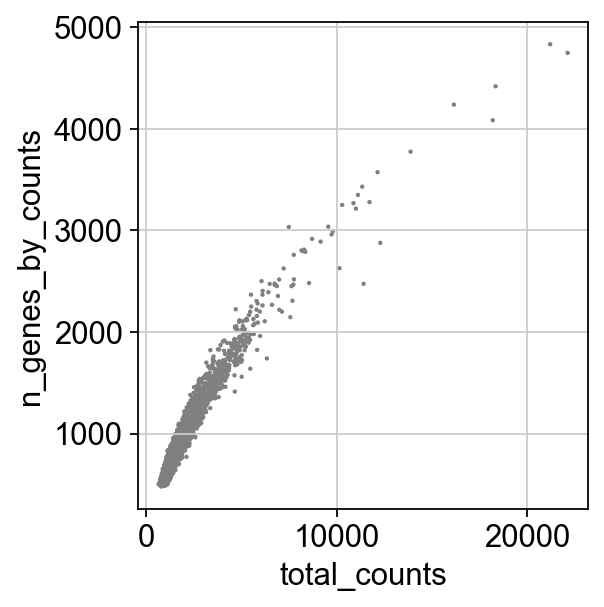
sc.pl.scatter(adata, x='total_counts', y='pct_counts_mt')
sc.pl.scatter(adata, x='total_counts', y='n_genes_by_counts')

[13]:
adata = adata[adata.obs.n_genes_by_counts < 3000, :]
adata = adata[adata.obs.pct_counts_mt < 8.5, :]

adata
C:\Users\SLiang3\Miniconda3\envs\scanpy37\lib\site-packages\anndata\_core\anndata.py:1094: FutureWarning: is_categorical is deprecated and will be removed in a future version.  Use is_categorical_dtype instead
  if not is_categorical(df_full[k]):
C:\Users\SLiang3\Miniconda3\envs\scanpy37\lib\site-packages\anndata\_core\anndata.py:1094: FutureWarning: is_categorical is deprecated and will be removed in a future version.  Use is_categorical_dtype instead
  if not is_categorical(df_full[k]):
[13]:
View of AnnData object with n_obs × n_vars = 7634 × 16839
    obs: 'cell subtype', 'cell type', 'n_genes', 'n_genes_by_counts', 'total_counts', 'total_counts_mt', 'pct_counts_mt'
    var: 'n_cells', 'mt', 'n_cells_by_counts', 'mean_counts', 'pct_dropout_by_counts', 'total_counts'
[14]:
sc.pp.normalize_total(adata, target_sum=1e4)
sc.pp.log1p(adata)
C:\Users\SLiang3\Miniconda3\envs\scanpy37\lib\site-packages\scanpy\preprocessing\_normalization.py:138: UserWarning: Revieved a view of an AnnData. Making a copy.
  view_to_actual(adata)
normalizing counts per cell
    finished (0:00:00)
[15]:
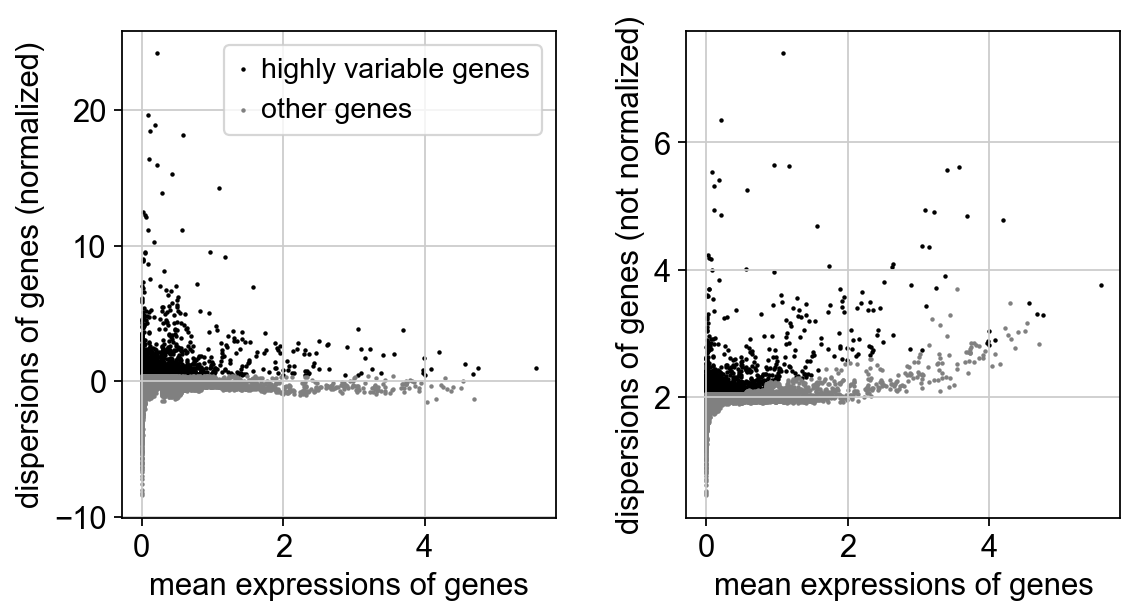
sc.pp.highly_variable_genes(adata, n_top_genes=3000)
sc.pl.highly_variable_genes(adata)
If you pass `n_top_genes`, all cutoffs are ignored.
extracting highly variable genes
    finished (0:00:01)
--> added
    'highly_variable', boolean vector (adata.var)
    'means', float vector (adata.var)
    'dispersions', float vector (adata.var)
    'dispersions_norm', float vector (adata.var)
[16]:
adata.var.highly_variable[adata.var.index.isin(['CD2',
                                                'CD3D', 'CD3E', 'CD3G',
                                                'CD4',
                                                'CD8A', 'CD8B',
                                                'ITGAX',
                                                'CD14',
                                                'FCGR3A', 'FCGR3B',
                                                'CD19',
                                                'PTPRC',
                                                'B3GAT1'
                                                ])]
[16]:
B3GAT1     True
CD14       True
CD19       True
CD2        True
CD3D       True
CD3E      False
CD3G       True
CD4       False
CD8A       True
CD8B       True
FCGR3A     True
FCGR3B    False
ITGAX     False
PTPRC     False
Name: highly_variable, dtype: bool
[17]:
adata.var.highly_variable[adata.var.index.isin(['CD2',
                                                'CD3D', 'CD3E', 'CD3G',
                                                'CD4',
                                                'CD8A', 'CD8B',
                                                'ITGAX',
                                                'CD14',
                                                'FCGR3A', 'FCGR3B',
                                                'CD19',
                                                'PTPRC',
                                                'B3GAT1'
                                                ])] = True
C:\Users\SLiang3\Miniconda3\envs\scanpy37\lib\site-packages\ipykernel_launcher.py:11: SettingWithCopyWarning:
A value is trying to be set on a copy of a slice from a DataFrame

See the caveats in the documentation: https://pandas.pydata.org/pandas-docs/stable/user_guide/indexing.html#returning-a-view-versus-a-copy
  # This is added back by InteractiveShellApp.init_path()
[18]:
#sc.pp.regress_out(adata, 'total_counts')
[19]:
sc.pp.scale(adata, max_value=10)
adata.raw = adata
[20]:
#adata = adata[:, adata.var.highly_variable]
adata
[20]:
AnnData object with n_obs × n_vars = 7634 × 16839
    obs: 'cell subtype', 'cell type', 'n_genes', 'n_genes_by_counts', 'total_counts', 'total_counts_mt', 'pct_counts_mt'
    var: 'n_cells', 'mt', 'n_cells_by_counts', 'mean_counts', 'pct_dropout_by_counts', 'total_counts', 'highly_variable', 'means', 'dispersions', 'dispersions_norm', 'mean', 'std'
    uns: 'log1p', 'hvg'
[21]:
sc.tl.pca(adata, svd_solver='arpack')
computing PCA
    on highly variable genes
    with n_comps=50
    finished (0:00:02)
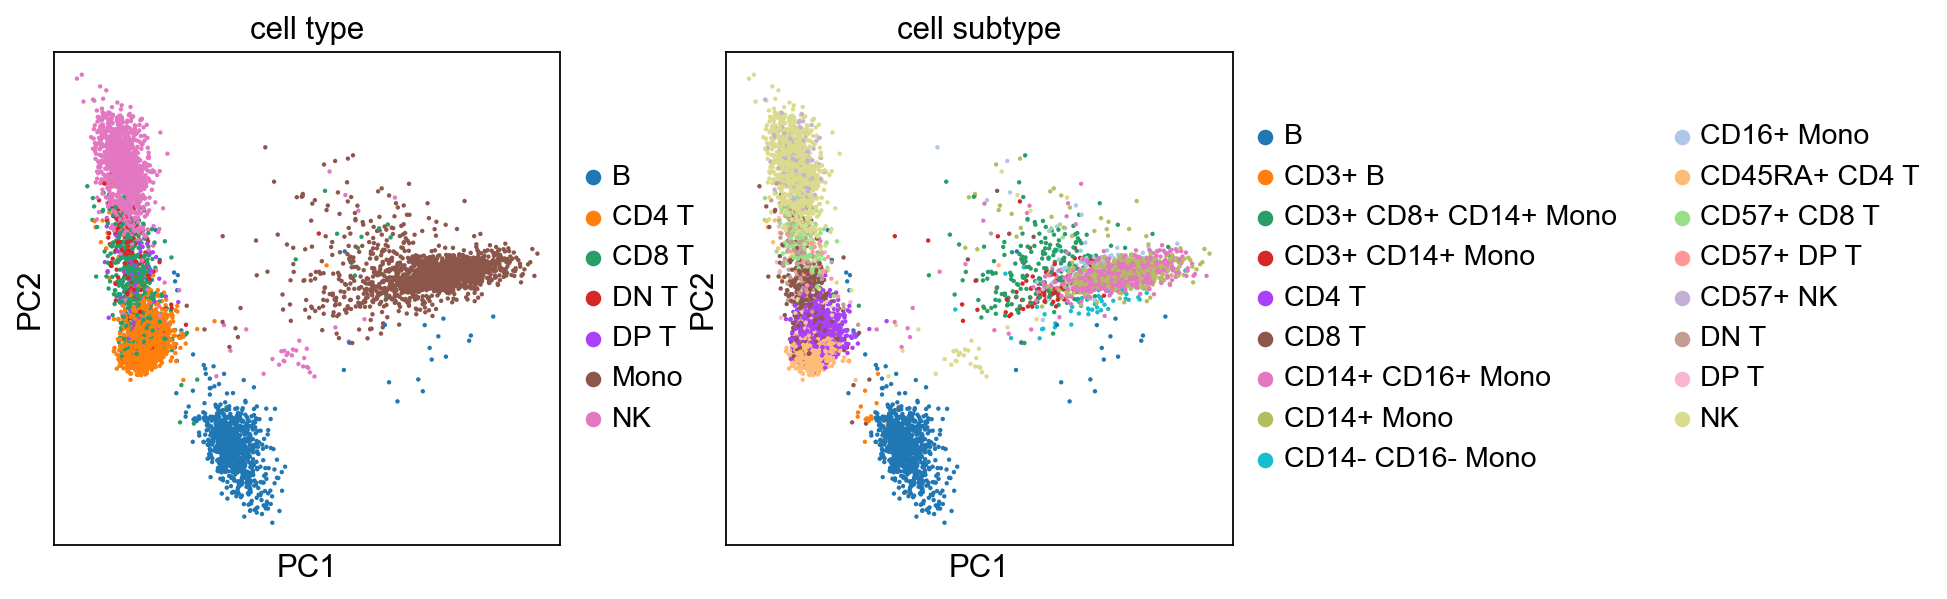
[28]:
sc.pl.pca(adata, color=['cell type', 'cell subtype'])
[ ]:
[23]:
sc.pl.pca_variance_ratio(adata, log=True)

[41]:
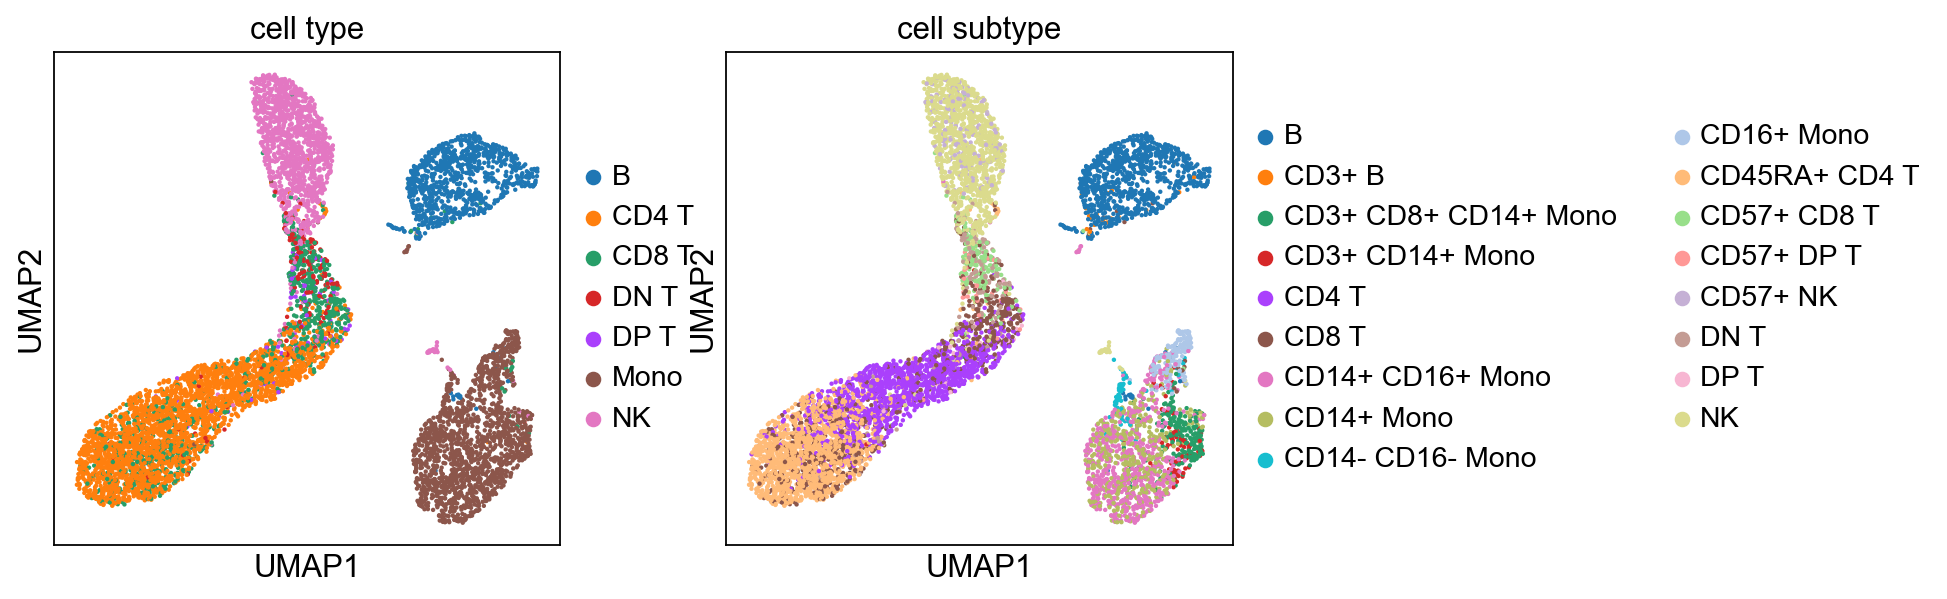
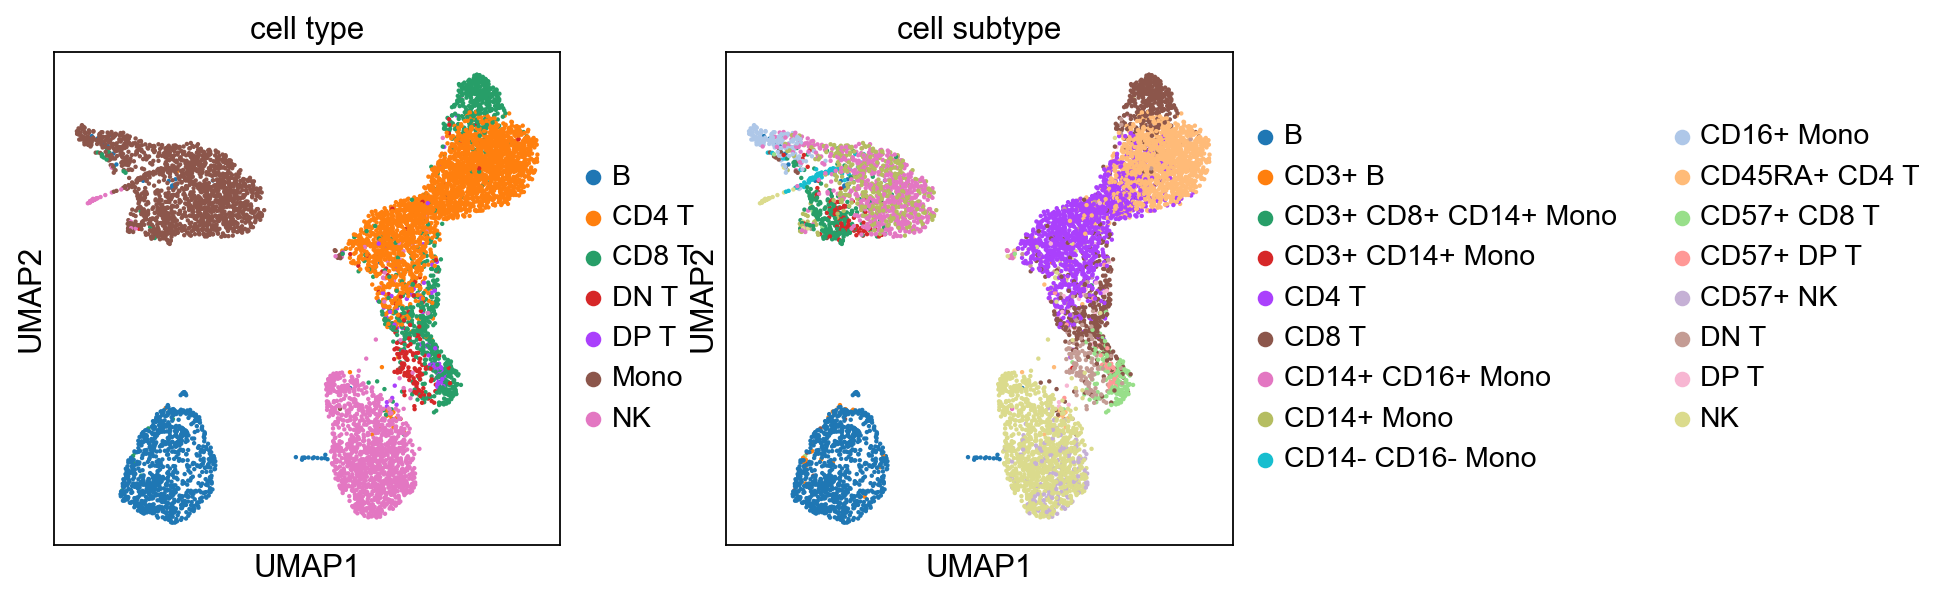
sc.pp.neighbors(adata, n_pcs=5)
sc.tl.umap(adata)
sc.tl.leiden(adata)
sc.pl.umap(adata, color=['cell type', 'cell subtype'])
computing neighbors
    using 'X_pca' with n_pcs = 5
    finished: added to `.uns['neighbors']`
    `.obsp['distances']`, distances for each pair of neighbors
    `.obsp['connectivities']`, weighted adjacency matrix (0:00:01)
computing UMAP
    finished: added
    'X_umap', UMAP coordinates (adata.obsm) (0:00:09)
running Leiden clustering
    finished: found 17 clusters and added
    'leiden', the cluster labels (adata.obs, categorical) (0:00:00)
[38]:
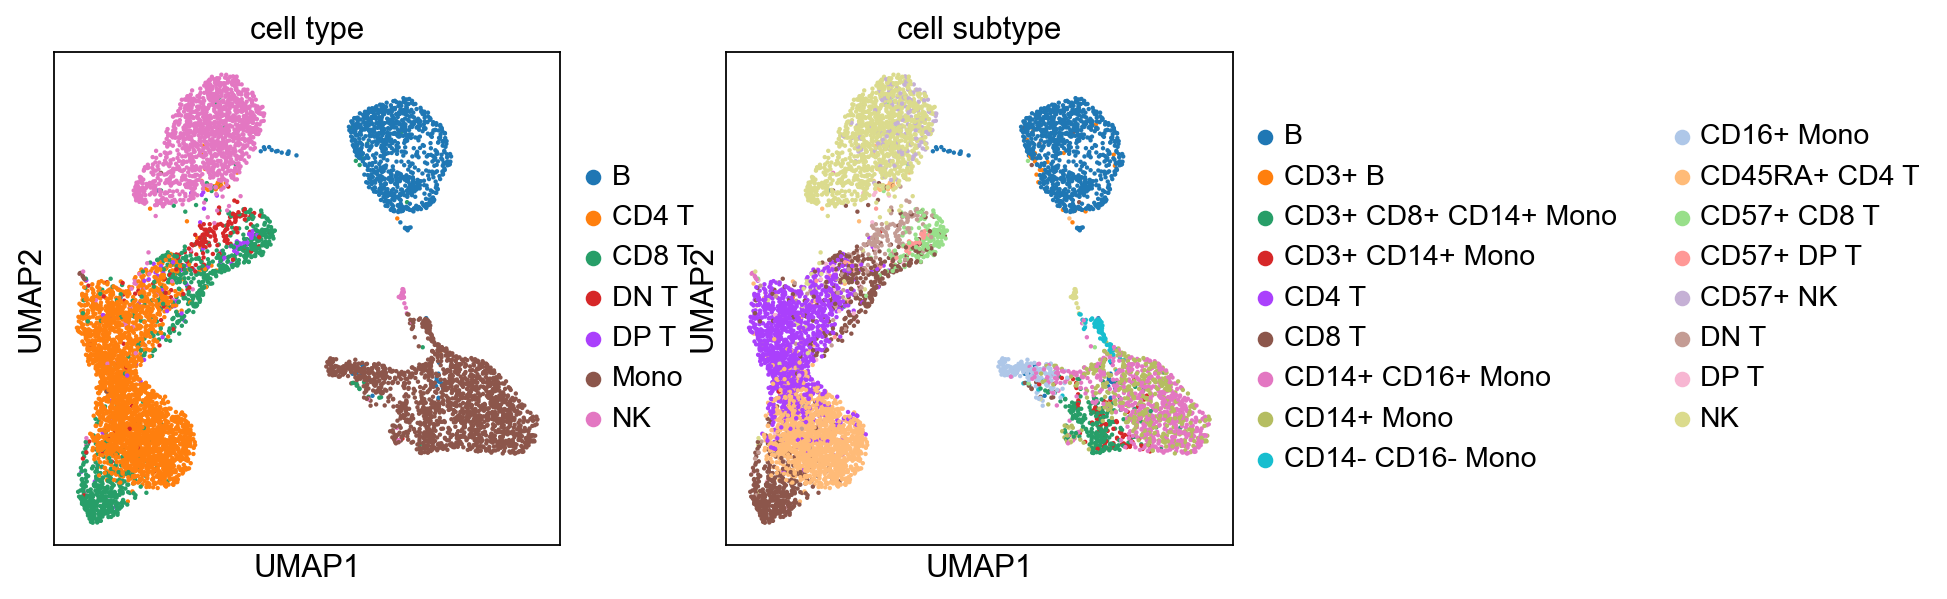
sc.pp.neighbors(adata, n_pcs=6)
sc.tl.umap(adata)
sc.tl.leiden(adata)
sc.pl.umap(adata, color=['cell type', 'cell subtype'])
computing neighbors
    using 'X_pca' with n_pcs = 6
    finished: added to `.uns['neighbors']`
    `.obsp['distances']`, distances for each pair of neighbors
    `.obsp['connectivities']`, weighted adjacency matrix (0:00:01)
computing UMAP
    finished: added
    'X_umap', UMAP coordinates (adata.obsm) (0:00:09)
running Leiden clustering
    finished: found 16 clusters and added
    'leiden', the cluster labels (adata.obs, categorical) (0:00:00)

[39]:
sc.pp.neighbors(adata, n_pcs=7)
sc.tl.umap(adata)
sc.tl.leiden(adata)
sc.pl.umap(adata, color=['cell type', 'cell subtype'])
computing neighbors
    using 'X_pca' with n_pcs = 7
    finished: added to `.uns['neighbors']`
    `.obsp['distances']`, distances for each pair of neighbors
    `.obsp['connectivities']`, weighted adjacency matrix (0:00:01)
computing UMAP
    finished: added
    'X_umap', UMAP coordinates (adata.obsm) (0:00:09)
running Leiden clustering
    finished: found 17 clusters and added
    'leiden', the cluster labels (adata.obs, categorical) (0:00:01)
[37]:
sc.pp.neighbors(adata, n_pcs=8)
sc.tl.umap(adata)
sc.tl.leiden(adata)
sc.pl.umap(adata, color=['cell type', 'cell subtype'])
computing neighbors
    using 'X_pca' with n_pcs = 8
    finished: added to `.uns['neighbors']`
    `.obsp['distances']`, distances for each pair of neighbors
    `.obsp['connectivities']`, weighted adjacency matrix (0:00:01)
computing UMAP
    finished: added
    'X_umap', UMAP coordinates (adata.obsm) (0:00:10)
running Leiden clustering
    finished: found 14 clusters and added
    'leiden', the cluster labels (adata.obs, categorical) (0:00:01)
[40]:
sc.pp.neighbors(adata, n_pcs=9)
sc.tl.umap(adata)
sc.tl.leiden(adata)
sc.pl.umap(adata, color=['cell type', 'cell subtype'])
computing neighbors
    using 'X_pca' with n_pcs = 9
    finished: added to `.uns['neighbors']`
    `.obsp['distances']`, distances for each pair of neighbors
    `.obsp['connectivities']`, weighted adjacency matrix (0:00:01)
computing UMAP
    finished: added
    'X_umap', UMAP coordinates (adata.obsm) (0:00:10)
running Leiden clustering
    finished: found 15 clusters and added
    'leiden', the cluster labels (adata.obs, categorical) (0:00:01)
[36]:
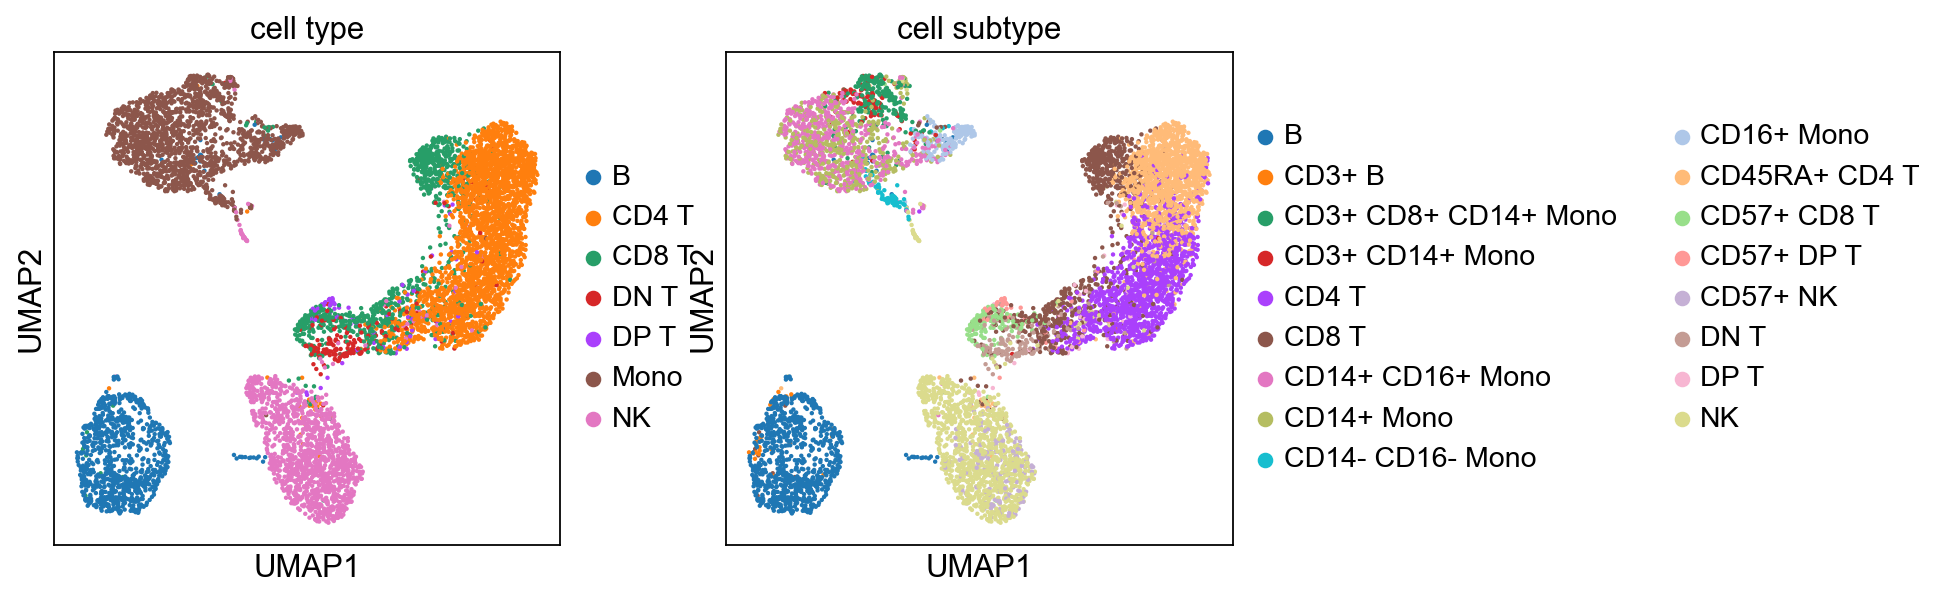
sc.pp.neighbors(adata, n_pcs=10)
sc.tl.umap(adata)
sc.tl.leiden(adata)
sc.pl.umap(adata, color=['cell type', 'cell subtype'])
computing neighbors
    using 'X_pca' with n_pcs = 10
    finished: added to `.uns['neighbors']`
    `.obsp['distances']`, distances for each pair of neighbors
    `.obsp['connectivities']`, weighted adjacency matrix (0:00:01)
computing UMAP
    finished: added
    'X_umap', UMAP coordinates (adata.obsm) (0:00:10)
running Leiden clustering
    finished: found 16 clusters and added
    'leiden', the cluster labels (adata.obs, categorical) (0:00:02)
[42]:
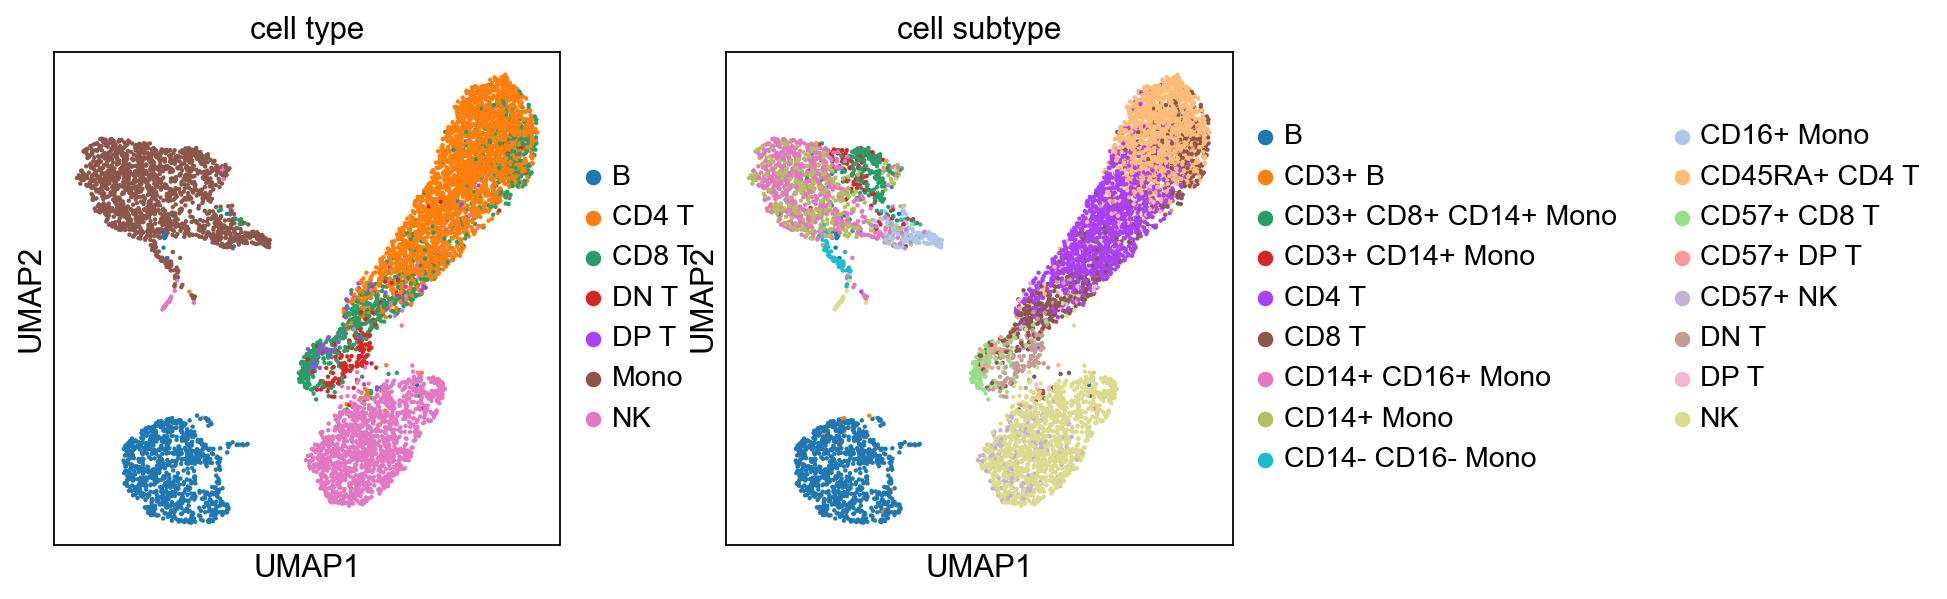
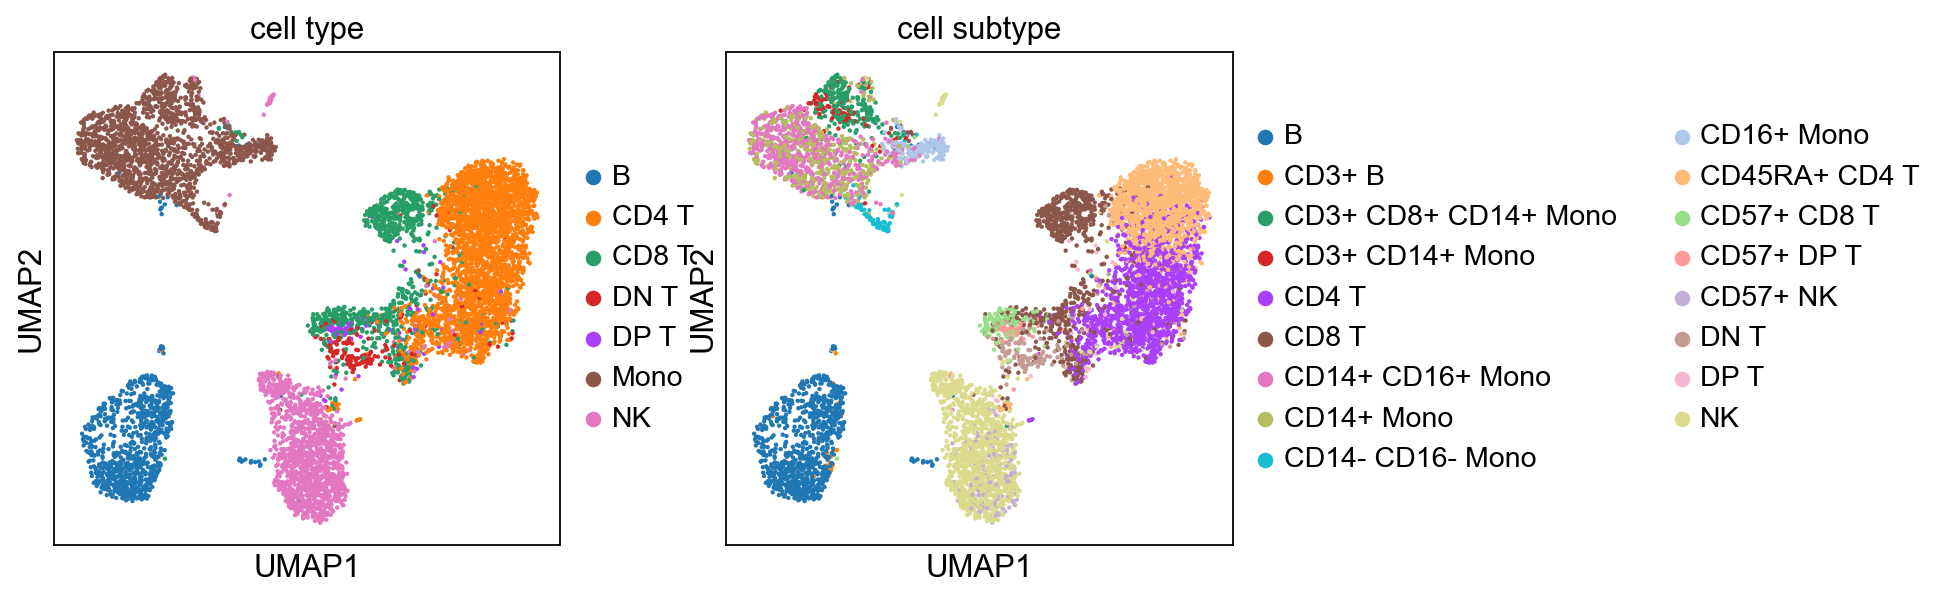
sc.pp.neighbors(adata, n_pcs=15)
sc.tl.umap(adata)
sc.tl.leiden(adata)
sc.pl.umap(adata, color=['cell type', 'cell subtype'])
computing neighbors
    using 'X_pca' with n_pcs = 15
    finished: added to `.uns['neighbors']`
    `.obsp['distances']`, distances for each pair of neighbors
    `.obsp['connectivities']`, weighted adjacency matrix (0:00:01)
computing UMAP
    finished: added
    'X_umap', UMAP coordinates (adata.obsm) (0:00:10)
running Leiden clustering
    finished: found 17 clusters and added
    'leiden', the cluster labels (adata.obs, categorical) (0:00:01)
[46]:
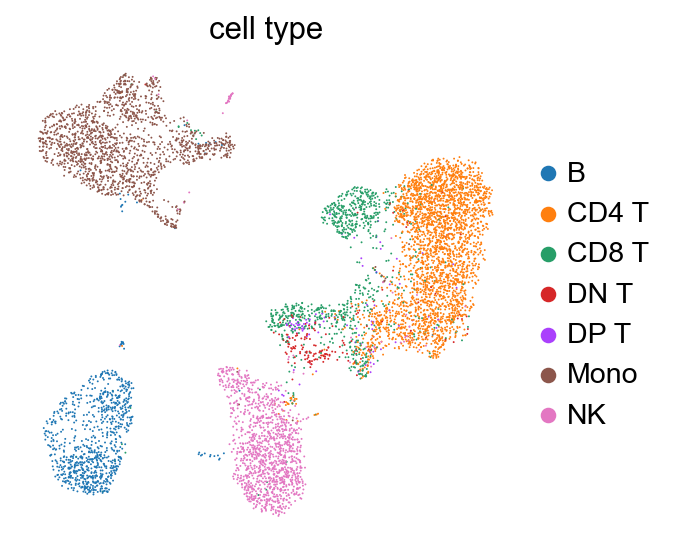
sc.pp.neighbors(adata, n_pcs=15)
sc.tl.umap(adata)
sc.tl.leiden(adata)
sc.pl.umap(adata, color=['cell type'], size=3., frameon=False)
computing neighbors
    using 'X_pca' with n_pcs = 15
    finished: added to `.uns['neighbors']`
    `.obsp['distances']`, distances for each pair of neighbors
    `.obsp['connectivities']`, weighted adjacency matrix (0:00:01)
computing UMAP
    finished: added
    'X_umap', UMAP coordinates (adata.obsm) (0:00:10)
running Leiden clustering
    finished: found 17 clusters and added
    'leiden', the cluster labels (adata.obs, categorical) (0:00:01)
[ ]:
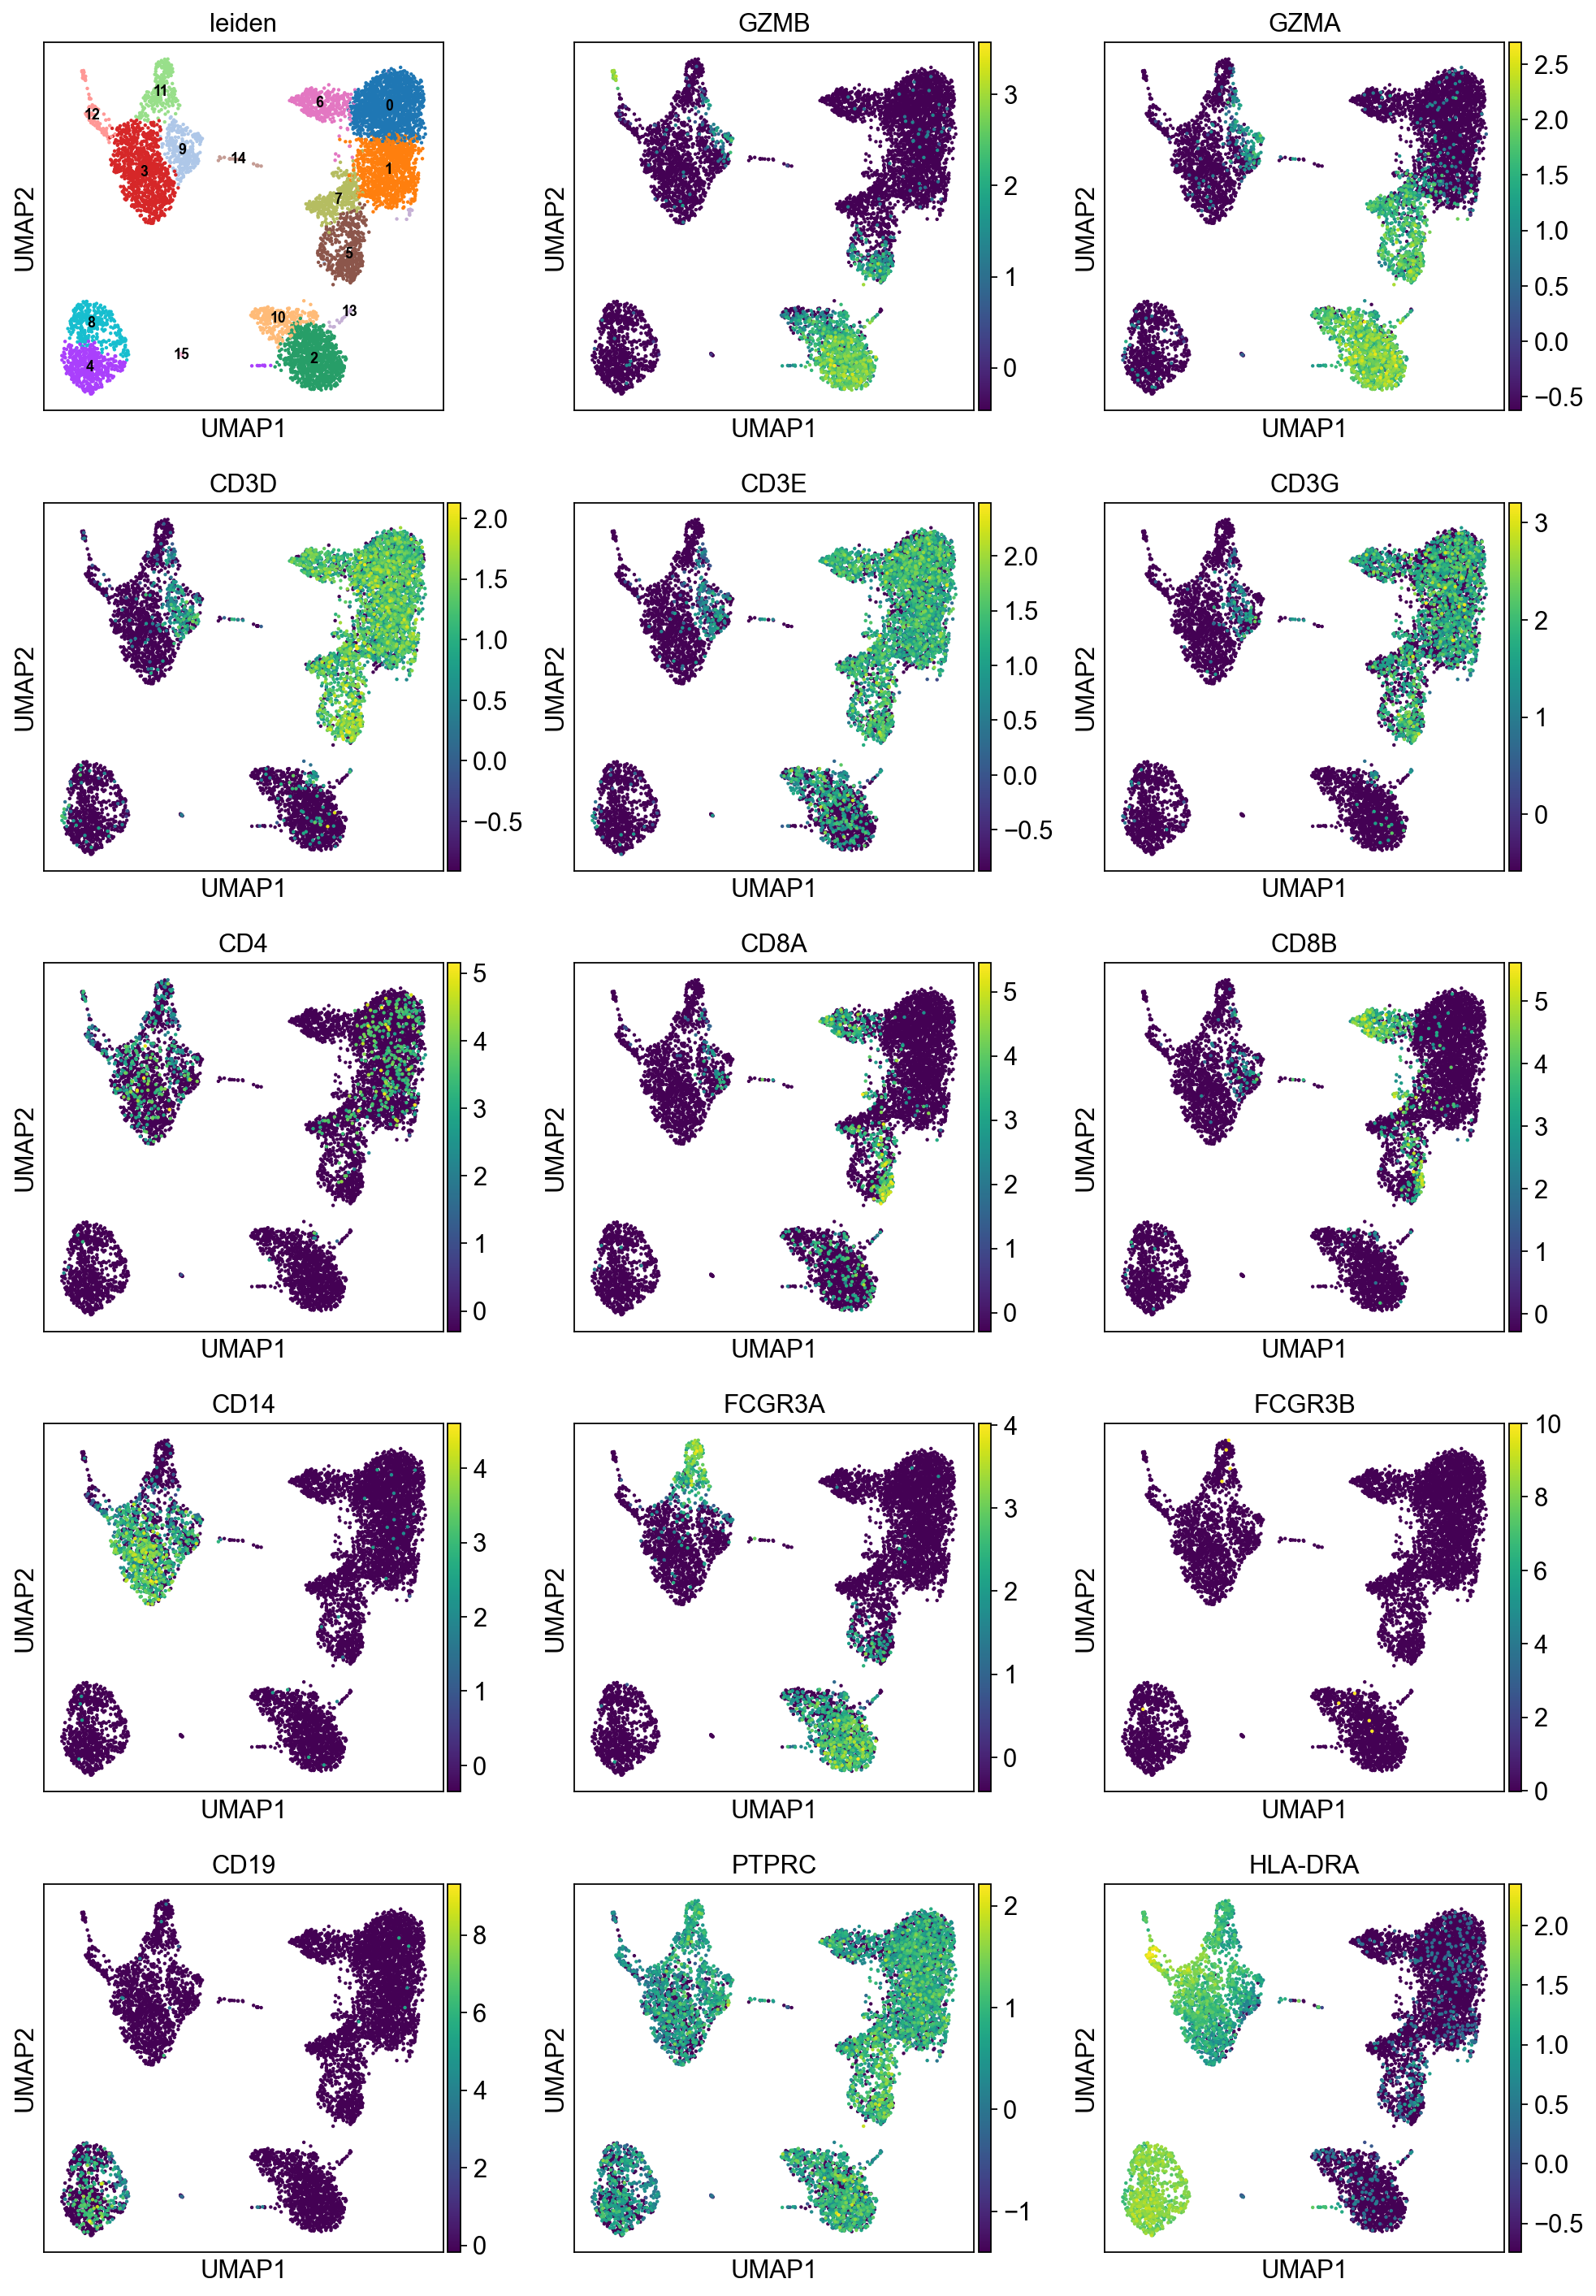
[26]:
sc.pl.umap(adata, color=['leiden',
                         'GZMB', 'GZMA', # NK (Granzyme)
                         'CD3D', 'CD3E', 'CD3G', 'CD4', 'CD8A', 'CD8B', # T CD4/CD8
                         'CD14', 'FCGR3A', 'FCGR3B', # MONO CD14 / (CD16 = FCGR)
                         'CD19', 'PTPRC', # B (CD45R = PTPRC)
                         'HLA-DRA',  # DC
                        ], ncols=3, legend_loc="on data", legend_fontsize=8.)
[27]:
adata.write("../../CITE-seq/rna.h5ad")