Melanoma TME (Tirosh et al.)
[1]:
import scanpy as sc
import os
import pandas as pd
import numpy as np
import pickle as pkl
import matplotlib as mpl
import matplotlib.pyplot as plt
import scipy.stats

sc.settings.verbosity = 3
[2]:
import sys
sys.path.insert(0,'..')
import scmer
1. Load and clean data
We download data from https://www.ncbi.nlm.nih.gov/geo/query/acc.cgi?acc=GSE72056
Tirosh I, Izar B, Prakadan SM, Wadsworth MH 2nd et al. Dissecting the multicellular ecosystem of metastatic melanoma by single-cell RNA-seq. Science 2016 Apr 8;352(6282):189-96.
1.1 Preprocessing
We first rename duplicate gene names.
[3]:
data = pd.read_table("../../Melanoma/GSE72056_melanoma_single_cell_revised_v2.txt", header=0)
def dedup(x):
    d = {}
    r = []
    for i in x:
        if i in d:
            d[i] += 1
            r.append(i + '_' + str(d[i]))
            print(i, 'renamed to', r[-1])
        else:
            d[i] = 1
            r.append(i)
    return r

data['Cell'] = dedup(data['Cell'])

data = data.T

data.columns = data.loc["Cell"]
data.drop('Cell', inplace=True)
data
MARCH2 renamed to MARCH2_2
MARCH1 renamed to MARCH1_2
[3]:
| Cell | tumor | malignant(1=no,2=yes,0=unresolved) | non-malignant cell type (1=T,2=B,3=Macro.4=Endo.,5=CAF;6=NK) | C9orf152 | RPS11 | ELMO2 | CREB3L1 | PNMA1 | MMP2 | TMEM216 | ... | GPLD1 | SNORD115-39 | RAB8A | RXFP2 | PCIF1 | PIK3IP1 | SNRPD2 | SLC39A6 | CTSC | AQP7 |
|---|---|---|---|---|---|---|---|---|---|---|---|---|---|---|---|---|---|---|---|---|---|
| Cy72_CD45_H02_S758_comb | 72 | 1 | 2 | 0 | 9.2172 | 0 | 0 | 0 | 0 | 0 | ... | 0.62667 | 0 | 0 | 0 | 0 | 7.6069 | 0 | 0 | 2.6638 | 0 |
| CY58_1_CD45_B02_S974_comb | 58 | 1 | 1 | 0 | 8.3745 | 0 | 0 | 0 | 0 | 0 | ... | 1.0545 | 0 | 0 | 0 | 0 | 0 | 0 | 0 | 6.9901 | 0 |
| Cy71_CD45_D08_S524_comb | 71 | 2 | 0 | 0 | 9.313 | 2.1263 | 0 | 0 | 0.73812 | 0 | ... | 0.99639 | 0 | 2.7634 | 0 | 3.6782 | 0 | 3.9871 | 3.8777 | 1.6126 | 0 |
| Cy81_FNA_CD45_B01_S301_comb | 81 | 2 | 0 | 0 | 7.8876 | 0 | 0 | 0 | 0 | 0 | ... | 0.23143 | 0 | 4.1937 | 0 | 0 | 0 | 5.2639 | 3.766 | 4.8417 | 0 |
| Cy80_II_CD45_B07_S883_comb | 80 | 2 | 0 | 0 | 8.3291 | 0 | 0 | 0 | 0 | 3.7949 | ... | 0 | 0 | 2.5705 | 0 | 0 | 0 | 6.0824 | 1.7816 | 4.4607 | 0 |
| ... | ... | ... | ... | ... | ... | ... | ... | ... | ... | ... | ... | ... | ... | ... | ... | ... | ... | ... | ... | ... | ... |
| CY75_1_CD45_CD8_7__S223_comb | 75 | 1 | 1 | 0 | 5.4889 | 0 | 0 | 0 | 0 | 0 | ... | 1.2962 | 0 | 0 | 0 | 0 | 0 | 6.0986 | 0 | 3.6464 | 0 |
| CY75_1_CD45_CD8_1__S65_comb | 75 | 1 | 1 | 0 | 4.9262 | 5.5296 | 0 | 0 | 0 | 0 | ... | 0.99245 | 0 | 0 | 0 | 5.5465 | 3.7384 | 0 | 0 | 7.0004 | 0 |
| CY75_1_CD45_CD8_1__S93_comb | 75 | 1 | 1 | 0 | 7.0958 | 0 | 0 | 0 | 0 | 0 | ... | 0.97516 | 0 | 0 | 0 | 0 | 0 | 0 | 0 | 1.9615 | 0 |
| CY75_1_CD45_CD8_1__S76_comb | 75 | 1 | 1 | 0 | 3.997 | 0 | 0 | 0 | 0 | 0 | ... | 0.49208 | 0 | 0 | 0 | 0 | 0 | 0 | 0 | 7.1918 | 0 |
| CY75_1_CD45_CD8_7__S274_comb | 75 | 1 | 0 | 0 | 3.9897 | 0 | 0 | 0 | 0 | 0.29007 | ... | 1.0682 | 0 | 0 | 0 | 5.0081 | 6.7535 | 5.9313 | 5.2398 | 6.1588 | 0 |
4645 rows × 23689 columns
We then separate metadata from gene expression and remove ERCC spike-ins.
[4]:
obs = data[['tumor', 'malignant(1=no,2=yes,0=unresolved)', 'non-malignant cell type (1=T,2=B,3=Macro.4=Endo.,5=CAF;6=NK)']]
data.drop(['tumor', 'malignant(1=no,2=yes,0=unresolved)', 'non-malignant cell type (1=T,2=B,3=Macro.4=Endo.,5=CAF;6=NK)'],
          axis=1, inplace=True)
print(*data.columns[data.columns.str.startswith('ERCC')], 'are dropped')
data = data.loc[:, data.columns.str.startswith('ERCC') == False]

obs
ERCC5 ERCC8 ERCC1 ERCC4 ERCC6L ERCC6L2 ERCC3 ERCC6 ERCC2 are dropped
[4]:
| Cell | tumor | malignant(1=no,2=yes,0=unresolved) | non-malignant cell type (1=T,2=B,3=Macro.4=Endo.,5=CAF;6=NK) |
|---|---|---|---|
| Cy72_CD45_H02_S758_comb | 72 | 1 | 2 |
| CY58_1_CD45_B02_S974_comb | 58 | 1 | 1 |
| Cy71_CD45_D08_S524_comb | 71 | 2 | 0 |
| Cy81_FNA_CD45_B01_S301_comb | 81 | 2 | 0 |
| Cy80_II_CD45_B07_S883_comb | 80 | 2 | 0 |
| ... | ... | ... | ... |
| CY75_1_CD45_CD8_7__S223_comb | 75 | 1 | 1 |
| CY75_1_CD45_CD8_1__S65_comb | 75 | 1 | 1 |
| CY75_1_CD45_CD8_1__S93_comb | 75 | 1 | 1 |
| CY75_1_CD45_CD8_1__S76_comb | 75 | 1 | 1 |
| CY75_1_CD45_CD8_7__S274_comb | 75 | 1 | 0 |
4645 rows × 3 columns
[5]:
pd.crosstab(obs['malignant(1=no,2=yes,0=unresolved)'], obs['non-malignant cell type (1=T,2=B,3=Macro.4=Endo.,5=CAF;6=NK)'])
[5]:
| non-malignant cell type (1=T,2=B,3=Macro.4=Endo.,5=CAF;6=NK) | 0.0 | 1.0 | 2.0 | 3.0 | 4.0 | 5.0 | 6.0 |
|---|---|---|---|---|---|---|---|
| malignant(1=no,2=yes,0=unresolved) | |||||||
| 0.0 | 90 | 24 | 3 | 6 | 3 | 5 | 1 |
| 1.0 | 416 | 2040 | 512 | 119 | 62 | 56 | 51 |
| 2.0 | 1252 | 4 | 0 | 1 | 0 | 0 | 0 |
[6]:
# Suppress SettingWithCopyWarning
import warnings
import pandas as pd
from pandas.core.common import SettingWithCopyWarning
warnings.simplefilter(action="ignore", category=SettingWithCopyWarning)

# Rename cell types for better appearance

malignant_dict = ['unresolved', 'normal', 'malignant']
celltype_dict = ['bordercase', 'T', 'B', 'Macro', 'Endo', 'CAF', 'NK']
obs['tumor'] = obs['tumor'].apply(lambda x: 'Mel' + str(int(x)))
obs['malignant'] = obs['malignant(1=no,2=yes,0=unresolved)'].astype(int).apply(malignant_dict.__getitem__)
obs['celltype'] = obs['non-malignant cell type (1=T,2=B,3=Macro.4=Endo.,5=CAF;6=NK)'].astype(int).apply(celltype_dict.__getitem__)
obs.loc[obs['malignant'] == 'malignant', 'celltype'] = 'malignant'
1.2 Create AnnData for scanpy
[7]:
adata = sc.AnnData(data)
for i in obs.columns:
    adata.obs[i] = obs[i]
[8]:
adata
[8]:
AnnData object with n_obs × n_vars = 4645 × 23677
    obs: 'tumor', 'malignant(1=no,2=yes,0=unresolved)', 'non-malignant cell type (1=T,2=B,3=Macro.4=Endo.,5=CAF;6=NK)', 'malignant', 'celltype'
2 Typical SCANPY analysis
2.1 QC
[9]:
sc.settings.set_figure_params(dpi=50, facecolor='white')
sc.pl.highest_expr_genes(adata, n_top=20)
normalizing counts per cell
    finished (0:00:00)
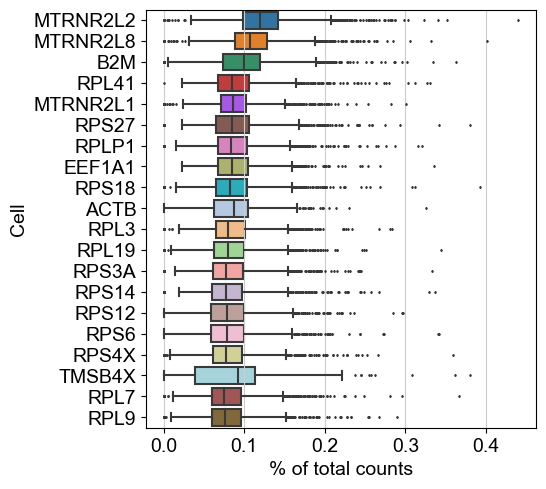
No mitochonrial genes available, which is okay.
[10]:
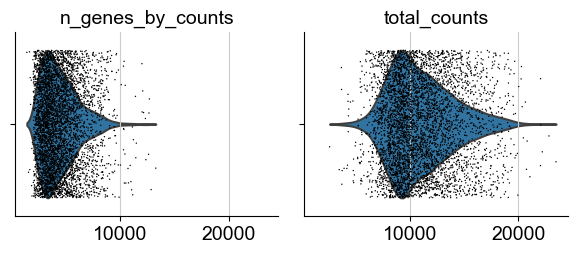
sc.pl.violin(adata, ['n_genes_by_counts', 'total_counts'], jitter=0.4, multi_panel=True)
C:\Users\SLiang3\Miniconda3\envs\scanpy37\lib\site-packages\anndata\_core\anndata.py:1192: FutureWarning: is_categorical is deprecated and will be removed in a future version.  Use is_categorical_dtype instead
  if is_string_dtype(df[key]) and not is_categorical(df[key])
... storing 'tumor' as categorical
... storing 'malignant(1=no,2=yes,0=unresolved)' as categorical
... storing 'non-malignant cell type (1=T,2=B,3=Macro.4=Endo.,5=CAF;6=NK)' as categorical
... storing 'malignant' as categorical
... storing 'celltype' as categorical
C:\Users\SLiang3\Miniconda3\envs\scanpy37\lib\site-packages\seaborn\_core.py:1303: UserWarning: Vertical orientation ignored with only `x` specified.
  warnings.warn(single_var_warning.format("Vertical", "x"))
C:\Users\SLiang3\Miniconda3\envs\scanpy37\lib\site-packages\seaborn\_core.py:1303: UserWarning: Vertical orientation ignored with only `x` specified.
  warnings.warn(single_var_warning.format("Vertical", "x"))
C:\Users\SLiang3\Miniconda3\envs\scanpy37\lib\site-packages\seaborn\_core.py:1303: UserWarning: Vertical orientation ignored with only `x` specified.
  warnings.warn(single_var_warning.format("Vertical", "x"))
C:\Users\SLiang3\Miniconda3\envs\scanpy37\lib\site-packages\seaborn\_core.py:1303: UserWarning: Vertical orientation ignored with only `x` specified.
  warnings.warn(single_var_warning.format("Vertical", "x"))
[11]:
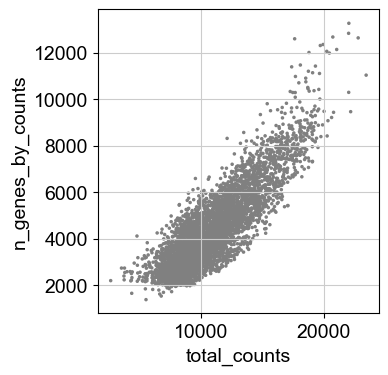
sc.pl.scatter(adata, x='total_counts', y='n_genes_by_counts')
[12]:
sc.pp.filter_cells(adata, min_genes=200)
sc.pp.filter_genes(adata, min_cells=3)
C:\Users\SLiang3\Miniconda3\envs\scanpy37\lib\site-packages\anndata\_core\anndata.py:1094: FutureWarning: is_categorical is deprecated and will be removed in a future version.  Use is_categorical_dtype instead
  if not is_categorical(df_full[k]):
filtered out 1397 genes that are detected in less than 3 cells
2.2 Normalization, HVG Selection, and Scaling
[13]:
sc.pp.normalize_total(adata, target_sum=1e4)
sc.pp.log1p(adata)
normalizing counts per cell
    finished (0:00:00)
[14]:
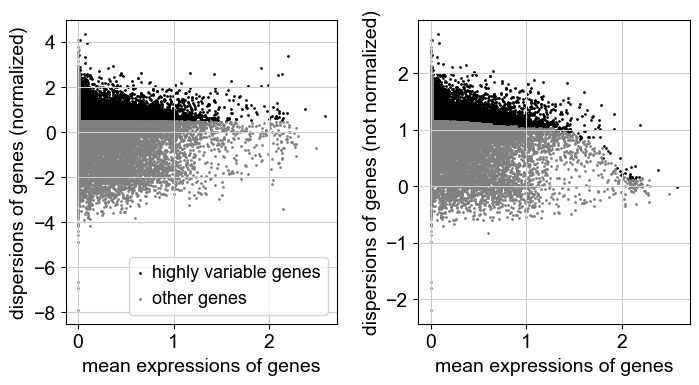
sc.pp.highly_variable_genes(adata, min_mean=0.0125, max_mean=3, min_disp=0.5)
extracting highly variable genes
    finished (0:00:01)
--> added
    'highly_variable', boolean vector (adata.var)
    'means', float vector (adata.var)
    'dispersions', float vector (adata.var)
    'dispersions_norm', float vector (adata.var)
[15]:
sc.pl.highly_variable_genes(adata)
[16]:
adata.raw = adata
[17]:
adata = adata[:, adata.var.highly_variable]
[18]:
sc.pp.scale(adata, max_value=10)
C:\Users\SLiang3\Miniconda3\envs\scanpy37\lib\site-packages\scanpy\preprocessing\_simple.py:806: UserWarning: Revieved a view of an AnnData. Making a copy.
  view_to_actual(adata)
[19]:
adata
[19]:
AnnData object with n_obs × n_vars = 4645 × 6219
    obs: 'tumor', 'malignant(1=no,2=yes,0=unresolved)', 'non-malignant cell type (1=T,2=B,3=Macro.4=Endo.,5=CAF;6=NK)', 'malignant', 'celltype', 'n_genes_by_counts', 'total_counts', 'total_counts_mt', 'pct_counts_mt', 'n_genes'
    var: 'mt', 'n_cells_by_counts', 'mean_counts', 'pct_dropout_by_counts', 'total_counts', 'n_cells', 'highly_variable', 'means', 'dispersions', 'dispersions_norm', 'mean', 'std'
    uns: 'log1p', 'hvg'
2.3 Dimensional Reduction
[20]:
sc.tl.pca(adata, svd_solver='arpack')
computing PCA
    on highly variable genes
    with n_comps=50
    finished (0:00:01)
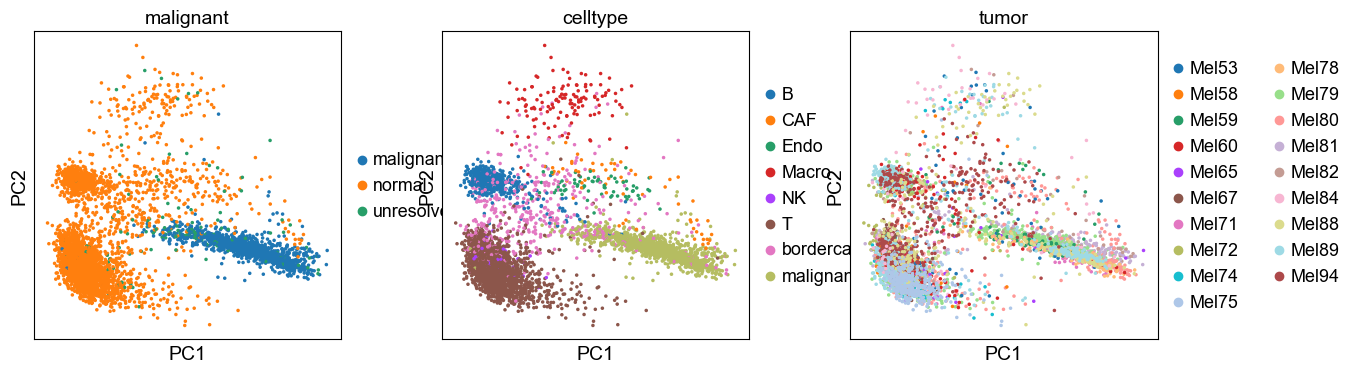
[21]:
sc.pl.pca(adata, color=['malignant', 'celltype', 'tumor'])
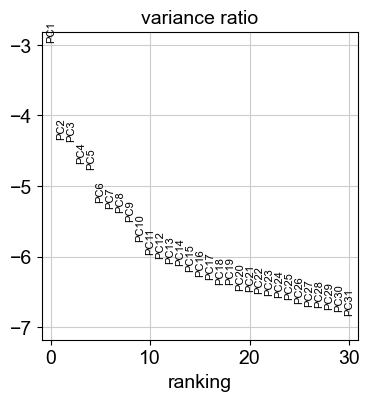
[22]:
sc.pl.pca_variance_ratio(adata, log=True)
[23]:
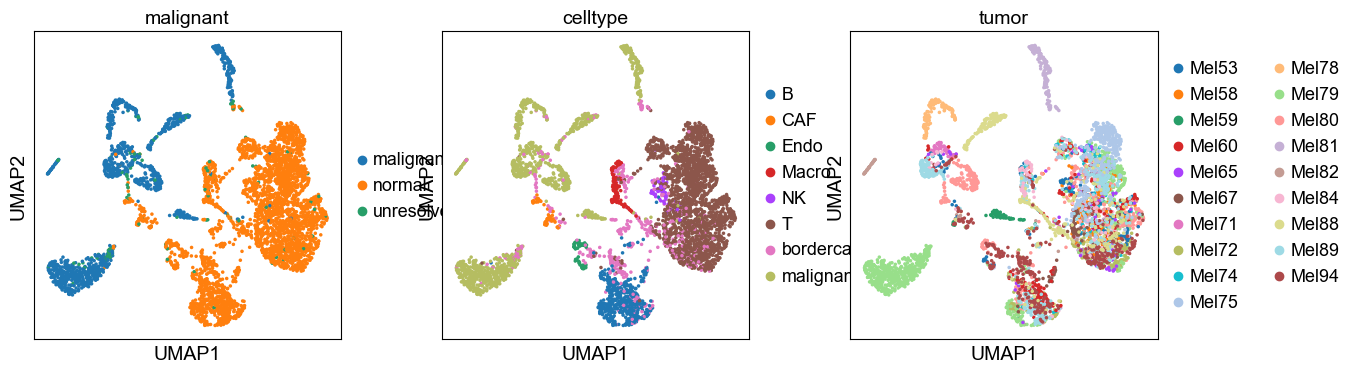
sc.pp.neighbors(adata, n_neighbors=10, n_pcs=20)
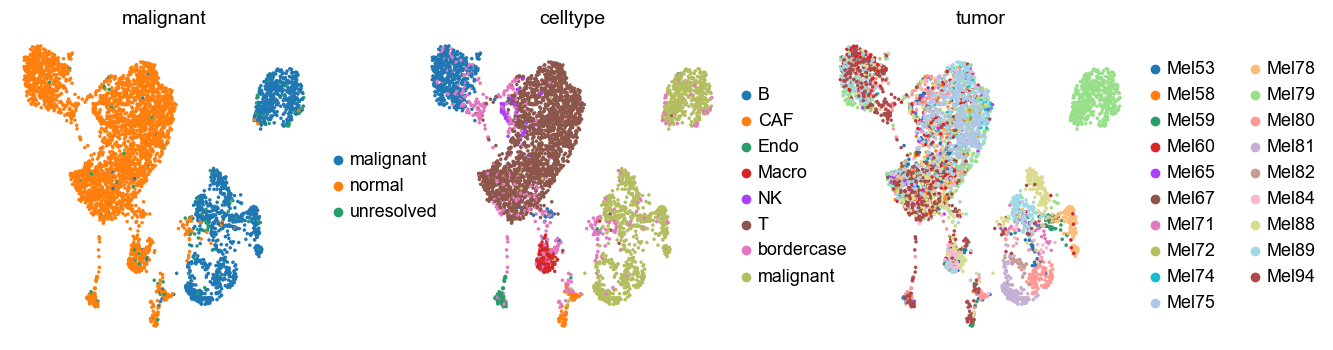
sc.tl.umap(adata)
sc.pl.umap(adata, color=['malignant', 'celltype', 'tumor'])
computing neighbors
    using 'X_pca' with n_pcs = 20
    finished: added to `.uns['neighbors']`
    `.obsp['distances']`, distances for each pair of neighbors
    `.obsp['connectivities']`, weighted adjacency matrix (0:00:03)
computing UMAP
    finished: added
    'X_umap', UMAP coordinates (adata.obsm) (0:00:05)
3. SCMER Feature Selection
Each step contains 20 inner iterations. It can be seen that the algorithm converges in 40~60 iternations.
As a rule of thumb, the loss should end up with 3.0~4.0. 0.0 is perfect but it needs many features. A loss greater than 4.0 usually mean that the manifold is not well retained.
[24]:
model = scmer.UmapL1(lasso=3.87e-4, ridge=0., n_pcs=40, perplexity=100., use_beta_in_Q=True, n_threads=6, pca_seed=2020)
model.fit(adata.X)
Calculating distance matrix and scaling factors...
Computing pairwise distances...
Using 6 threads...
Mean value of sigma: 1.206104
Done. Elapsed time: 20.78 seconds. Total: 20.78 seconds.
Creating model without batches...
Optimizing using OWLQN (because lasso is nonzero)...
0 loss: 6.253872871398926 Nonzero: 80 Elapsed time: 89.79 seconds. Total: 110.58 seconds.
1 loss: 3.090698003768921 Nonzero: 76 Elapsed time: 89.34 seconds. Total: 199.92 seconds.
2 loss: 3.0756547451019287 Nonzero: 75 Elapsed time: 102.79 seconds. Total: 302.71 seconds.
3 loss: 3.0753679275512695 Nonzero: 75 Elapsed time: 108.61 seconds. Total: 411.32 seconds.
4 loss: 3.0753376483917236 Nonzero: 75 Elapsed time: 85.93 seconds. Total: 497.25 seconds.
final loss: 2.9645748138427734 Nonzero: 75 Elapsed time: 1.45 seconds. Total: 498.70 seconds.
[24]:
<scmer._umap_l1.UmapL1 at 0x24547e99dc8>
Selected markers:
[25]:
print(*adata.var_names[model.get_mask()])
RPS11 CXCL13 B2M GNLY SERPINA3 CD55 TXNIP DEDD RPS4Y1 RGS1 PTPRC PDCD1 HAVCR2 A2M TYR COL1A2 VIM SRGN ELK2AP NME2 GPR183 CDH5 PAEP KIT CCR7 TCL1A ANXA1 C1orf56 NKG7 MFAP4 GZMH MTRNR2L2 GZMA CD52 RGS10 CXCR4 MIR4461 COL1A1 TYMS MCM5 OAS2 PTPRCAP PMEL SPOCK2 PRAME AURKB MIA SELPLG APOD UXS1 IFITM1 MAGEC2 TYROBP IRF8 CD69 CD8A TNFAIP3 HLA-DQA1 TIGIT CD27 MS4A1 LSP1 TCF7 C10orf54 SYTL3 TOB1 CCL4 TOX PRDM1 CTLA4 GZMB HAPLN3 HLA-DQB1 HLA-DPA1 LTB
4. Validation
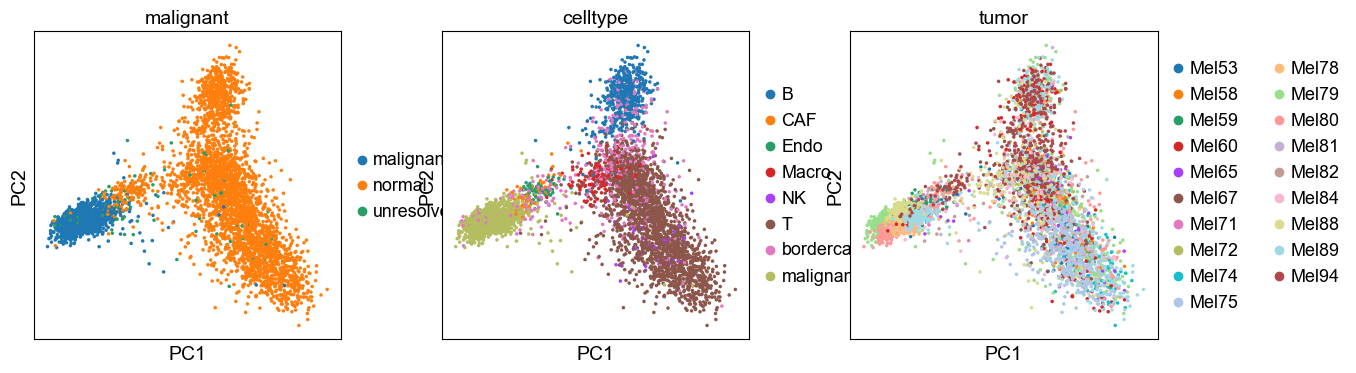
4.1 PCA and UMAP validation
The PCA and UMAP largely resemble the ones obtained from all genes.
[26]:
new_adata = model.transform(adata)
sc.tl.pca(new_adata, svd_solver='arpack')
sc.pl.pca(new_adata, color=['malignant', 'celltype', 'tumor'])
sc.pp.neighbors(new_adata, n_pcs=10, use_rep="X_pca")
sc.tl.umap(new_adata)
sc.pl.umap(new_adata, color=['malignant', 'celltype', 'tumor'], frameon=False)
computing PCA
    on highly variable genes
    with n_comps=50
C:\Users\SLiang3\Miniconda3\envs\scanpy37\lib\site-packages\anndata\_core\anndata.py:1094: FutureWarning: is_categorical is deprecated and will be removed in a future version.  Use is_categorical_dtype instead
  if not is_categorical(df_full[k]):
finished (0:00:00)
computing neighbors
    finished: added to `.uns['neighbors']`
    `.obsp['distances']`, distances for each pair of neighbors
    `.obsp['connectivities']`, weighted adjacency matrix (0:00:00)
computing UMAP
    finished: added
    'X_umap', UMAP coordinates (adata.obsm) (0:00:06)
4.2 Gene sets analysis
4.2.1 Gene sets from the original publication
[27]:
import pickle as pkl
with open("../../Melanoma/markers.pkl", 'rb') as file:
    markers = pkl.load(file)

selected_markers = adata.var_names[model.get_mask()].tolist()
all_markers = adata.var_names.tolist()

for i in markers:
    print(i, len(set(markers[i]).intersection(set(selected_markers))), '/',
          len(set(markers[i]).intersection(set(all_markers))), "(", len(markers[i]), "):", end=" ")
    print(*set(markers[i]).intersection(set(selected_markers)))
axl 2 / 52 ( 100 ): HAPLN3 CD52
mitf 3 / 28 ( 100 ): TOB1 PMEL TYR
cell-cycle 3 / 54 ( 93 ): TYMS AURKB MCM5
melanoma 5 / 19 ( 47 ): TYR PRAME PMEL SERPINA3 MIA
b 2 / 27 ( 31 ): IRF8 MS4A1
t 7 / 38 ( 38 ): TCF7 PRDM1 CD8A NKG7 SPOCK2 TOX TIGIT
macro 1 / 73 ( 92 ): TYROBP
endo 2 / 45 ( 95 ): HAPLN3 CDH5
caf 3 / 46 ( 88 ): COL1A1 MFAP4 COL1A2
exhaustion-consistent 3 / 17 ( 28 ): CXCL13 CD27 TIGIT
exhaustion_variable 7 / 159 ( 272 ): HLA-DPA1 TOX SRGN CTLA4 HAVCR2 PDCD1 IRF8
4.2.2 Genes not in the gene sets above
[28]:
temp = set(selected_markers.copy())
for i in markers:
    temp -= set(markers[i])

print(*temp)
NME2 MIR4461 RGS1 KIT CCR7 HLA-DQB1 OAS2 GZMA B2M APOD TXNIP IFITM1 C10orf54 DEDD ANXA1 GZMB RGS10 LSP1 TNFAIP3 MTRNR2L2 UXS1 SELPLG TCL1A PAEP C1orf56 ELK2AP GZMH A2M GNLY CD55 VIM SYTL3 PTPRCAP CD69 PTPRC CXCR4 CCL4 RPS11 GPR183 HLA-DQA1 LTB RPS4Y1 MAGEC2
4.2.3 Genes in EMT pathway
[29]:
emt_markers = scmer.Comparison.read_gmt(
    "../../Melanoma/HALLMARK_EPITHELIAL_MESENCHYMAL_TRANSITION.gmt")['HALLMARK_EPITHELIAL_MESENCHYMAL_TRANSITION']

scmer.Comparison.compare(y_true=emt_markers, y_pred=selected_markers)
[29]:
'4/200 recalled in the gene set by 75 predicted genes, overlapping genes are COL1A1, VIM, COL1A2, TNFAIP3.'
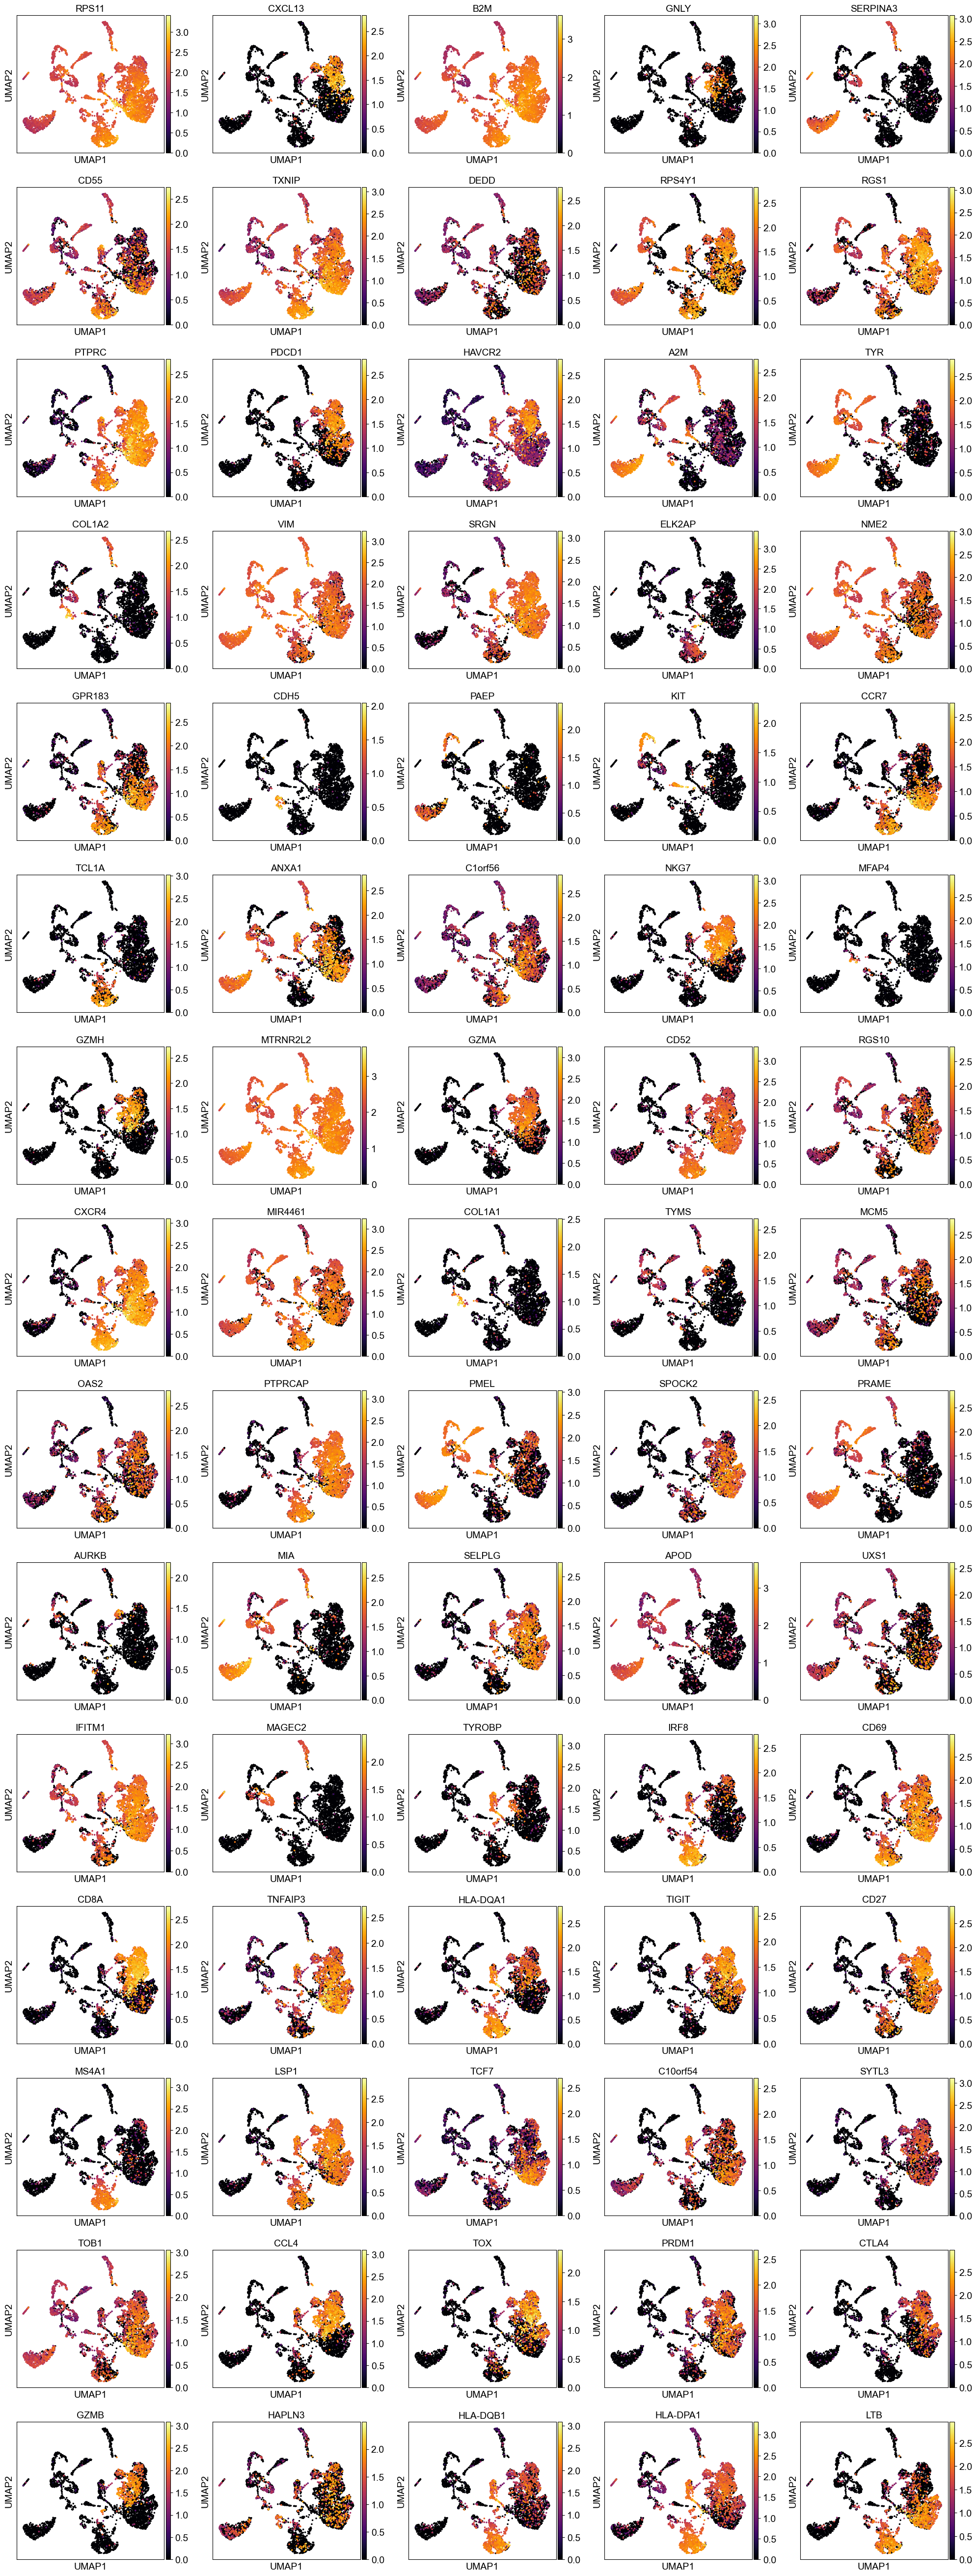
4.3 Scatter Plot of the Selected Features
[30]:
sc.settings.set_figure_params(dpi=50, facecolor='white')
sc.pl.umap(adata, color=selected_markers, ncols=5, legend_loc="on data", legend_fontsize=8., color_map="inferno")
5. Session Info
[31]:
sc.logging.print_versions()
WARNING: If you miss a compact list, please try `print_header`!
-----
anndata     0.7.4
scanpy      1.6.0
sinfo       0.3.1
-----
PIL                 7.2.0
anndata             0.7.4
backcall            0.2.0
cairo               1.19.1
cffi                1.14.2
colorama            0.4.3
cycler              0.10.0
cython_runtime      NA
dateutil            2.8.1
decorator           4.4.2
get_version         2.1
h5py                2.10.0
igraph              0.8.2
importlib_metadata  1.7.0
ipykernel           5.3.4
ipython_genutils    0.2.0
ipywidgets          7.5.1
jedi                0.17.2
joblib              0.16.0
kiwisolver          1.2.0
legacy_api_wrap     1.2
leidenalg           0.8.1
llvmlite            0.33.0+1.g022ab0f
matplotlib          3.3.1
mkl                 2.3.0
mpl_toolkits        NA
natsort             7.0.1
nt                  NA
ntsecuritycon       NA
numba               0.50.1
numexpr             2.7.1
numpy               1.19.1
packaging           20.4
pandas              1.1.1
parso               0.7.0
pickleshare         0.7.5
pkg_resources       NA
prompt_toolkit      3.0.7
pycparser           2.20
pygments            2.6.1
pyparsing           2.4.7
pythoncom           NA
pytz                2020.1
pywintypes          NA
scanpy              1.6.0
scipy               1.5.2
scmer               NA
seaborn             0.11.0
setuptools_scm      NA
sinfo               0.3.1
six                 1.15.0
sklearn             0.23.2
sphinxcontrib       NA
statsmodels         0.11.1
storemagic          NA
tables              3.6.1
texttable           1.6.2
torch               1.6.0
tornado             6.0.4
tqdm                4.48.2
traitlets           4.3.3
umap                0.4.6
wcwidth             0.2.5
win32api            NA
win32com            NA
win32security       NA
zipp                NA
zmq                 19.0.1
-----
IPython             7.18.1
jupyter_client      6.1.6
jupyter_core        4.6.3
notebook            6.1.1
-----
Python 3.7.7 (default, May  6 2020, 11:45:54) [MSC v.1916 64 bit (AMD64)]
Windows-10-10.0.17763-SP0
12 logical CPU cores, Intel64 Family 6 Model 158 Stepping 10, GenuineIntel
-----
Session information updated at 2020-11-11 19:54
[ ]: